Traders in the crypto market could be active again as tokens might be used as collateral with banks. Also tokenized versions of money market and treasury bond mutual funds would drive demand for the crypto market in general. Tokenized US government bonds have jumped 80% so far this year. Traders believe that they offer a more attractive place than stablecoins to park their money. Furthermore, the US government will potentially enable investors to use parts of the 401(k)-retirement scheme to also buy tokens, which would add fresh demand to the market if implemented.
Technical analysis:
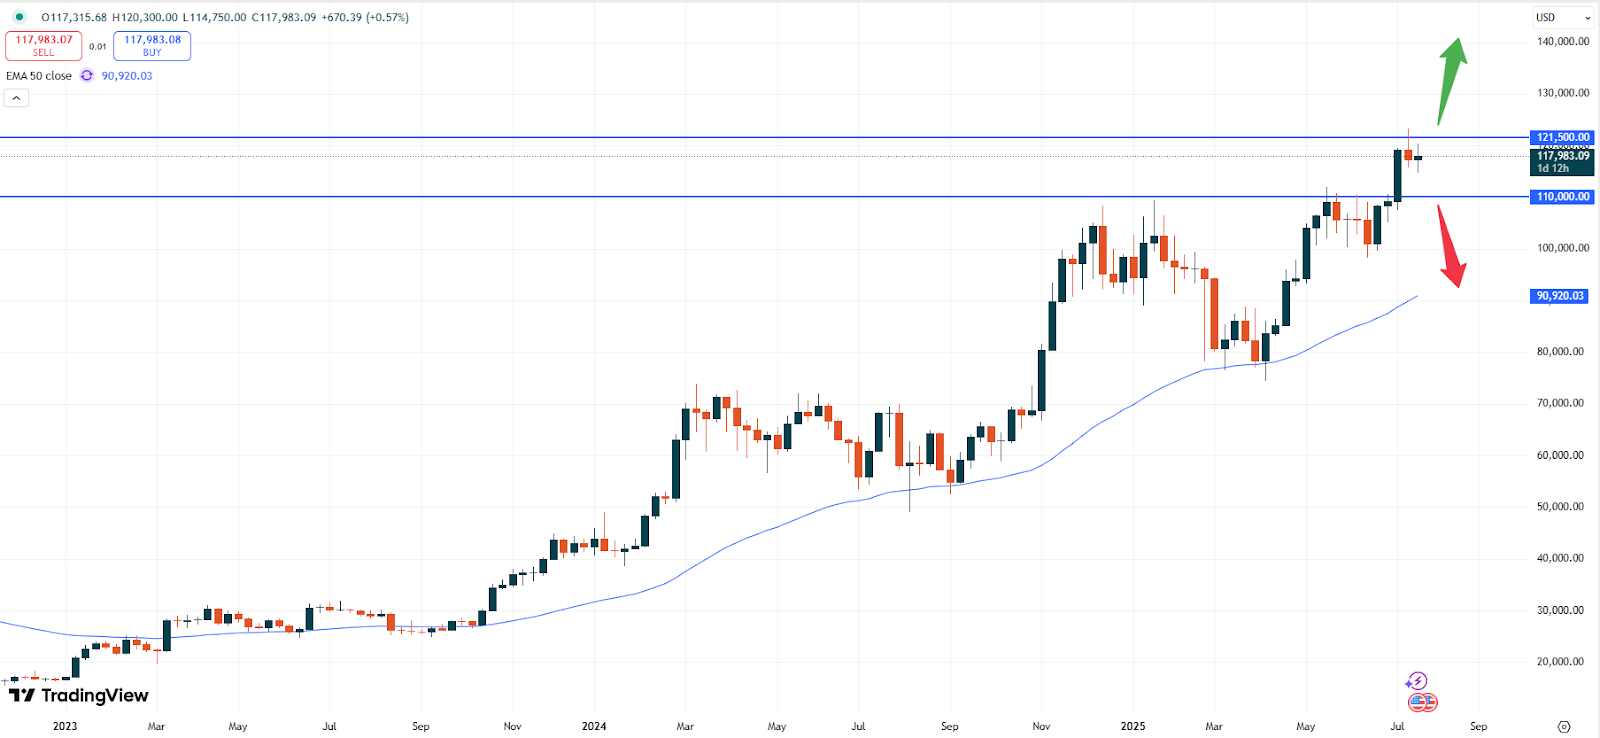
– BTC: Bitcoin is trading at USD 117,989. Last week ended in a slight correction after prices attempted to move higher again. The bullish trend remains intact but a correction the Bitcoin seems to be due for now.
BTCUSD, weekly chart
As the weekly chart above shows, more upside momentum seems to be on the cards. Any break towards the technical support zone at USD 110,000 might hence be used as an entry while a correction to lower prices should be traded with caution.
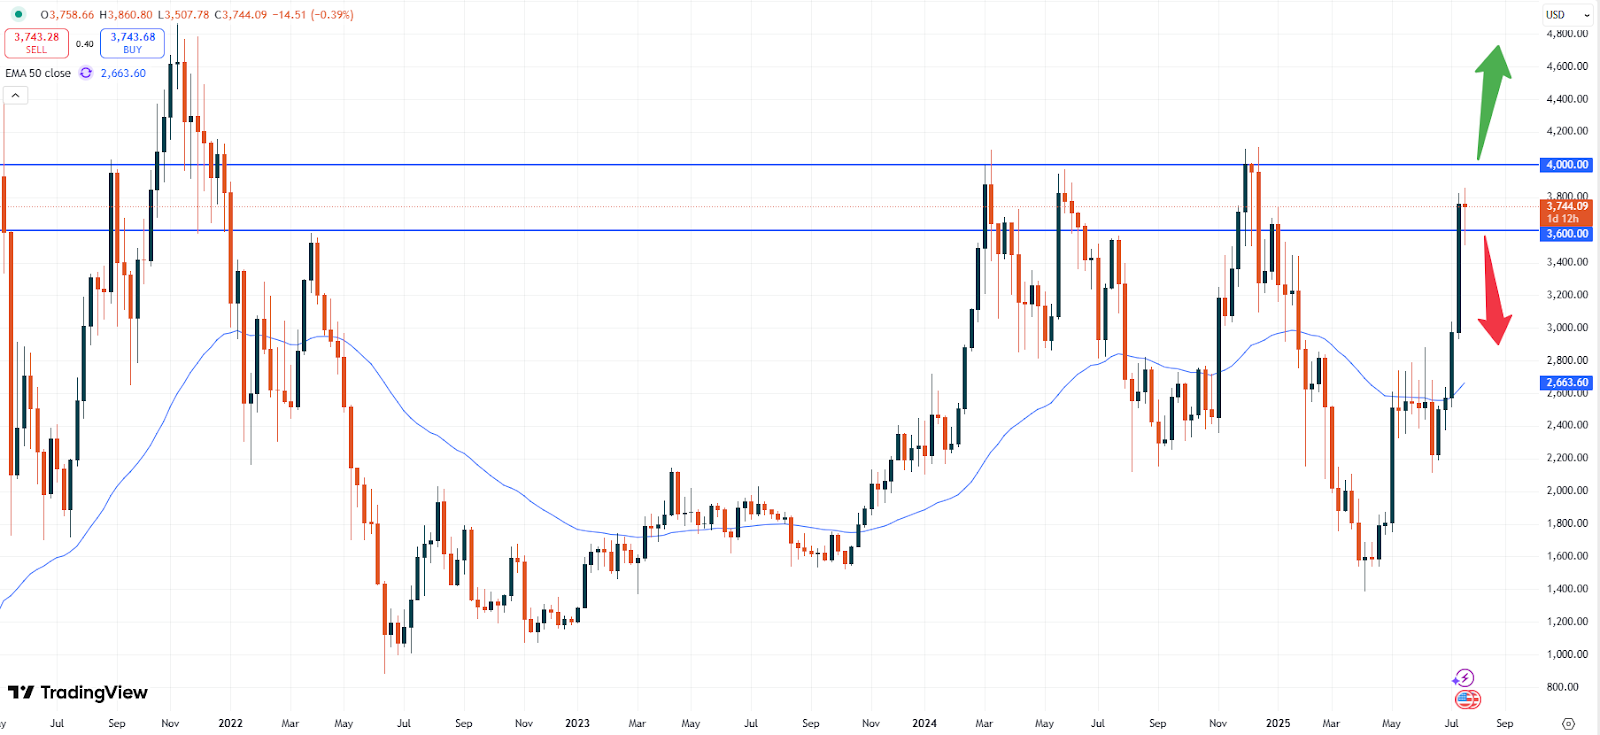
– ETH: Ethereum is currently trading at USD 3,743 and remains in a very bullish pattern. Based on the weekly chart the market seems to be ready to break to the upside. It might just be a matter of time until the USD 4,000 level can be broken.
ETHUSD, weekly chart
A break of the technical resistance, which has been tested several times over the course of last year seems hence on the cards. The price is then expected to move towards the USD 4,700 range.
– XRP: XRP is currently trading at USD 3.1859. After the huge momentum this month, the market seems to be capped in sideways price action for now. The technical USD 3,0000 zone might then offer good support in the meantime.
XRPUSD, monthly chart
Ripple continues to look positive and the implementation of the XRP- stablecoin might also offer more upside, here. Shorter term charts like weekly already suggest, that the upside is being resumed. After retracing towards the USD 3.000 level, upside momentum has already been observed. Positive signs after all for XRP.
– SOL: Solana is currently trading at USD 187.65. This token keeps lagging behind as previously mentioned.
SOLUSD, monthly chart
The psychological resistance zone at USD 200.00 continues to remain of big resistance. A push beyond that level might ignite fast upside momentum towards USD 280.00. On the other hand, the current level might also act as a head and shoulders pattern, which could push the market lower as well. Traders should remain cautious with Solana.
Vantage does not represent or warrant that the material provided here is accurate, current, or complete, and therefore should not be relied upon as such. The information provided here, whether from a third party or not, is not to be considered as a recommendation; or an offer to buy or sell; or the solicitation of an offer to buy or sell any financial instruments; or to participate in any specific trading strategy. Any research provided does not have regard to the specific investment objectives, financial situation and needs of any specific person who may receive it. We advise any readers of this content to seek their own advice. Without the approval of Vantage, reproduction or redistribution of this information is not permitted.