The crypto sector is currently correcting and looks like it might weaken further. With US equities and in particular the Nasdaq index potentially being ripe for lower levels in September also the crypto space might be in for a bumpy ride. Most tokens tend to follow the momentum of US indices.
Ethereum was able to offer record levels in terms of transaction volumes as well as ETF inflows and hence able to create a new all- time- high. A correction after such attempt is just normal and would also underpin the bullish momentum moving forward.
Technical analysis:
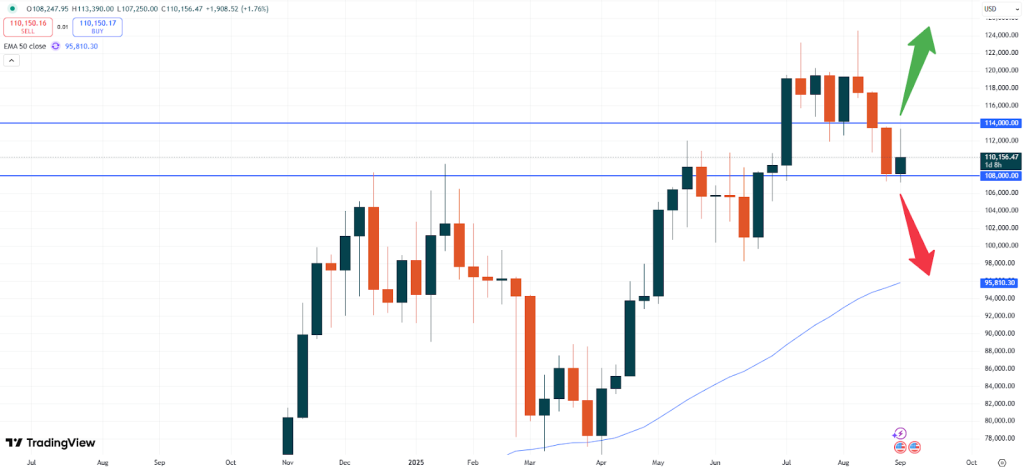
– BTC: Bitcoin is trading at USD 110,200. Based on the weekly chart the price looks set to weaken further. After trying higher levels last week, the market ended in a bearish pattern. The weekly chart below shows the important zones and it looks like prices will fall further. A break of the USD 108,000 level might indicate further bearish momentum.
BTCUSD, weekly chart
If the above-mentioned support zone breaks, the target could be the 50- moving average, which currently sits at USD 95,815. Yet, the bearish pattern might also find strong support at the previous resistance at USD 105,000, depending on the momentum of the Nasdaq 100.
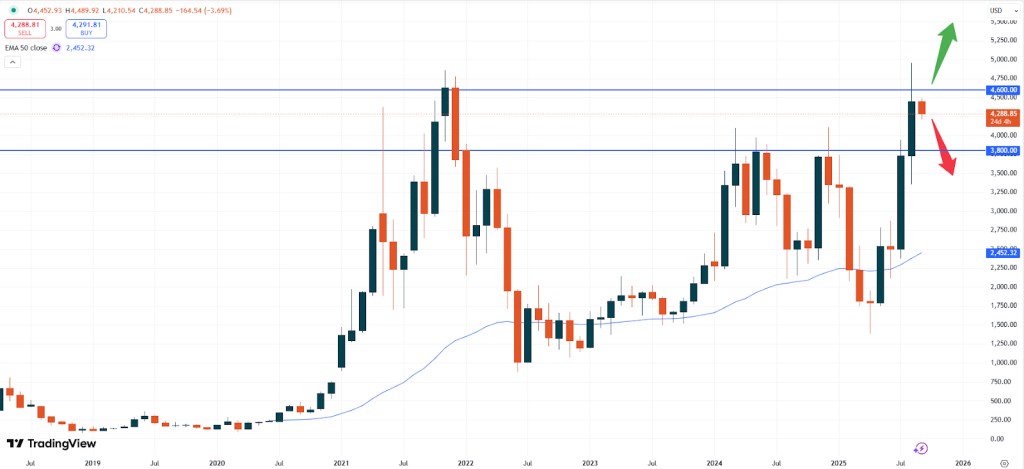
– ETH: Ethereum is currently trading at USD 4,2890. Similar to Bitcoin the market is also heading lower for now. In general, the positive trend in Ethereum is still intact but the market keeps retracing following the overall trend.
ETHUSD, monthly chart
With potential support being close the uptrend might be tested whereas a break of the USD 4,6000 zone is needed to unleash strong upside momentum. Only a push below the USD 3,8000 zone might unleash more downside pressure leading to a break towards the USD 3,0000 level.
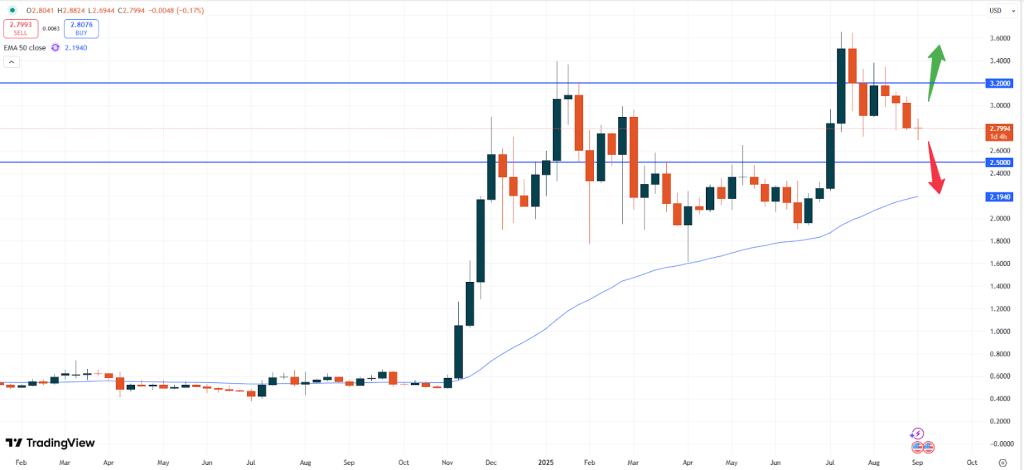
– XRP: Ripple is trading at USD 2.7980. After testing the USD 3.0000 level, the market resumed fresh downside momentum. Currently it looks like, that the downside momentum will continue and prices are about to test the USD 2,5000 level.
XRPUSD, weekly chart
Since the uptrend is still intact prices might just weaken for now before an attempt to move higher will occur. Traders should still also keep in mind that new XRP- ETFs will help adding fresh buying momentum at some point.
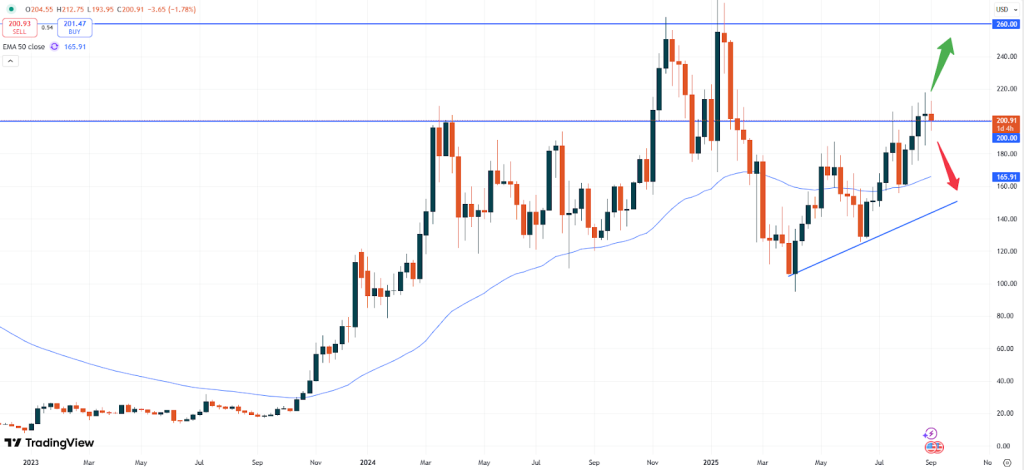
– SOL: Solana is trading at USD 200,91. The market just went above the recent technical resistance zone of USD 200.00 when it started retracing. Should the crypto sector move lower in general also Solana will weaken further.
SOLUSD, weekly chart
As the chart above shows, important levels would be the 50- moving average at about USD 165.90 as well as the rising trendline at about USD 150.00. If prices move higher an attempt towards the USD 260.00 level might be seen as pointed out several times in the past.
Vantage does not represent or warrant that the material provided here is accurate, current, or complete, and therefore should not be relied upon as such. The information provided here, whether from a third party or not, is not to be considered as a recommendation; or an offer to buy or sell; or the solicitation of an offer to buy or sell any financial instruments; or to participate in any specific trading strategy. Any research provided does not have regard to the specific investment objectives, financial situation and needs of any specific person who may receive it. We advise any readers of this content to seek their own advice. Without the approval of Vantage, reproduction or redistribution of this information is not permitted.