Recent remarks from John Williams, the chair of the Federal Reserve Bank of New York, initially helped the price of Bitcoin to rise again on Friday last week. A weaker Dollar would help pushing markets to higher levels again. Also, stock markets started a slight rebound until the negative market sentiment kicked back in. Yet, the fear in markets about the AI sector in general currently weighs on the market, initiated by the hawkish statements in late October. It seems that after months of positive market sentiment negative news are currently being paid more attention to.
The generally positive year- end rally seems currently in far distance. The sentiment turns negative and ETF outflows currently also cause markets to weaken further. Will hence the crypto winter continue for now?
Technical Analysis
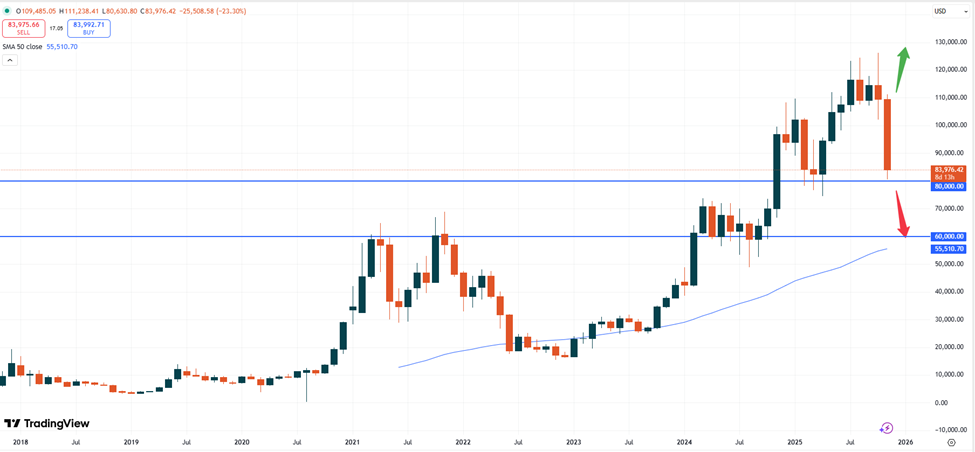
BTC – Bitcoin is trading at USD 83,976. With the big push lower also during last week’s trading, the positive sentiment has been fading further. Bitcoin’s weakness might also continue to push other markets lower. US indices like the Nasdaq remains under pressure and the fading trust in the AI sector due to the high valuations also does not help, either.
BTCUSD monthly chart
The break of the important psychological USD 90,000 price level does now indicate that the bearish momentum might continue. The next support zone can only be found at USD 80,000. That level, which also acted as support in March this year will determine the future trend. A push higher from that zone could indicate another test of the all-time- high.
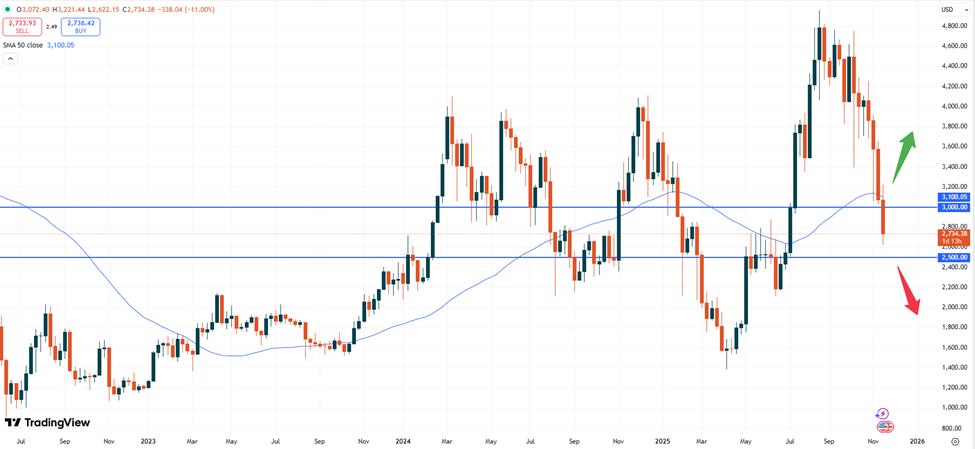
ETH – Ethereum is currently trading at USD 2,733. Similarly to Bitcoin also Ethereum is losing steam. Last week, the market broke the important 50- moving average zone, which can be found at USD 3,100 based on the weekly chart. This break might now indicate that prices will continue to fall further.
ETHUSD weekly chart
A break of this level to the upside is needed in order to offer another attempt for this token to move higher again. Yet, the negative sentiment might rather push ETH down towards the next support level of USD 2,500. Positive sentiment might then emerge again, if the level will not break.
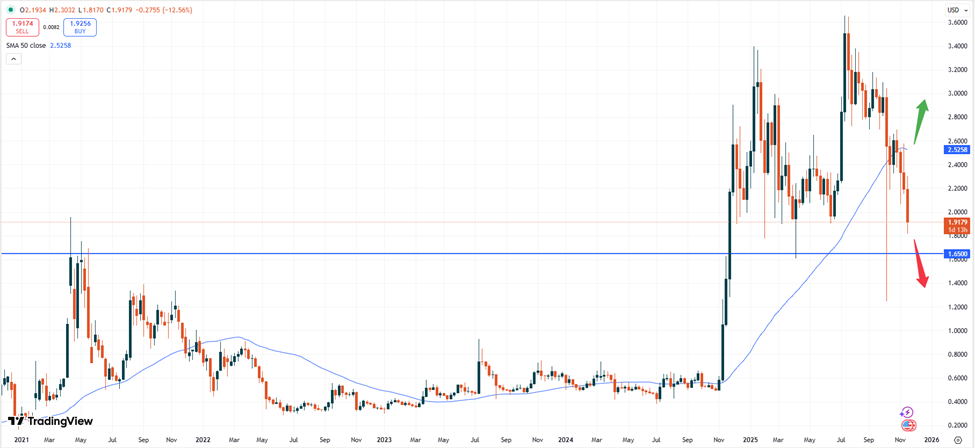
XRP – Ripple is currently trading at USD 1.9153. Despite having held rather stable in recent week, XRP keeps now also pushing lower. Especially the break of the 50- moving average seems now to cause sellers to remain in control.
XRPUSD weekly chart
With Ripple trading below the psychological level of USD 2.0000 more downside momentum might now follow. Should the price break away further now, the selling pressure could even intensify. As the chart shows, the important previous resistance zone from May 2022 might then offer upcoming support at USD 1.6500 if prices continue to fall further.
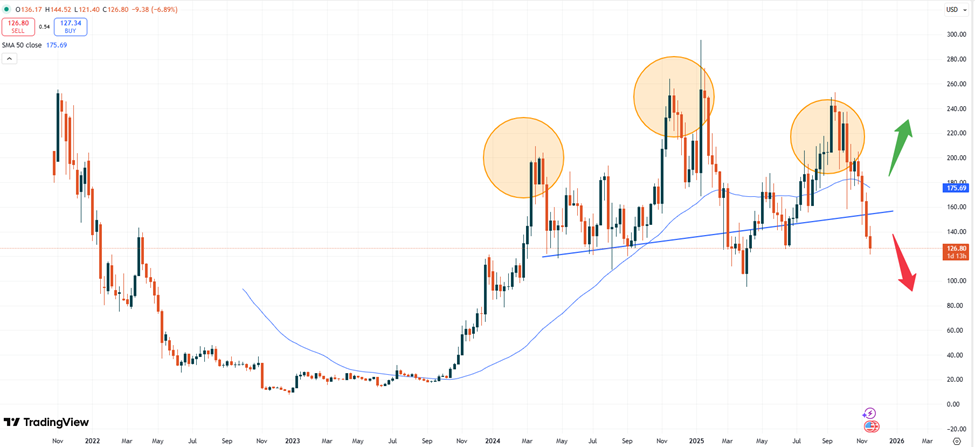
SOL – Solana is currently trading at USD 126.80. The pressure in this market continues to be dominate by the technical head- and- shoulders pattern.
SOLUSD weekly chart
As we pointed out before the break of the neckline at around the USD 160.00 zone continues to add negative momentum. Last week, the market attempted another attempt to move higher but, in the end, closed well below the USD 140.00 level. The psychological USD 100.00 price target is now in close proximity.
Vantage does not represent or warrant that the material provided here is accurate, current, or complete, and therefore should not be relied upon as such. The information provided here, whether from a third party or not, is not to be considered as a recommendation; or an offer to buy or sell; or the solicitation of an offer to buy or sell any financial instruments; or to participate in any specific trading strategy. Any research provided does not have regard to the specific investment objectives, financial situation and needs of any specific person who may receive it. We advise any readers of this content to seek their own advice. Without the approval of Vantage, reproduction or redistribution of this information is not permitted.