The crypto market mostly remains in a sideways pattern, with a slight bearish trend for now. Bitcoin has been trading lower and most other tokens kept following the same path. Some observers stated that Bitcoin is comparable to Gold and should be seen as a safe- haven asset. Yet while the gold price has been rising sharply in recent months the price of the digital asset seemingly kept following other rules. Geopolitical tensions caused gold to rise more than 8% while Bitcoin was falling nearly 7% at the same time.
Both gold and bitcoin might continue the positive trend during geopolitical uncertainties as well as monetary policy fluctuations. Bitcoin on the other hand, seems to be used rather get access to quick cash during uncertain times.
Technical Analysis
BTC – Bitcoin is trading at USD 88,926 and has fallen below the prices of last week. While the trend looks constructive the market remains in a sideways pattern. If the USD 85,000 price level does not break the uptrend might still be resumed.
BTCUSD daily chart
On a technical note, we can also observe that the market keeps trading around the important 50- moving average zone currently. This might act as guidance, as that zone can currently be found at the USD 90,000 price level. A jump above and the bullish trend might resume quickly.
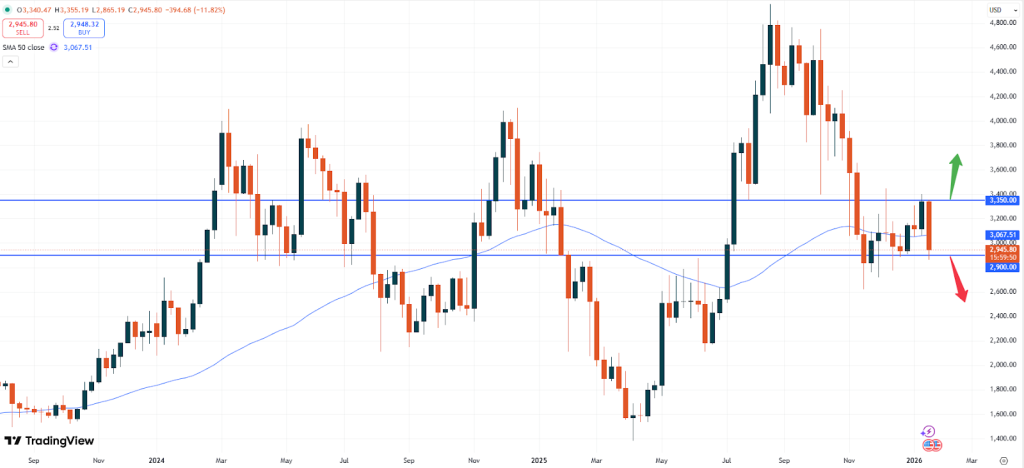
ETH – Ethereum is currently trading at USD 2,945. This market looks similar compared to Bitcoin but has moved slightly lower. The break of the USD 3,000 level might indicate a further slide as the psychological zone has been broken. On the other hand, upside momentum might still form, as the recent support level is still intact.
ETHUSD weekly chart
Without a clear break of the USD 2,900 price level the upside might still continue, led by a potential rise in Bitcoin and overall positive risk sentiment in the equity market.
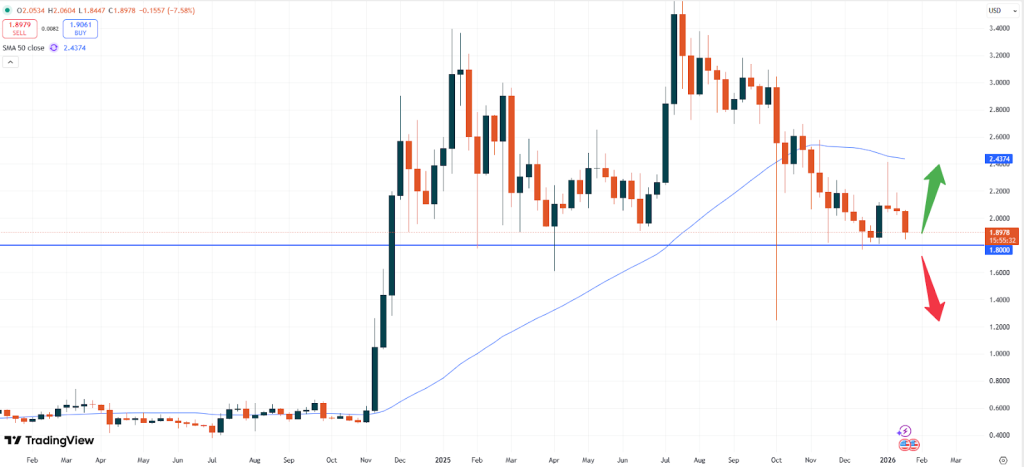
XRP – Ripple is currently trading at USD 1.8973. The positive trend seems to fade day- by- day, as the market does make any attempts to potentially rise. Instead, the negative momentum might increase with the break of the USD 1.8000 price level.
XRPUSD weekly chart
The weekly chart above shows, that the bearish pinbar candlestick is still in control. Since the market did not break back above the psychological USD 2.0000 price level the slide in prices might simply continue.
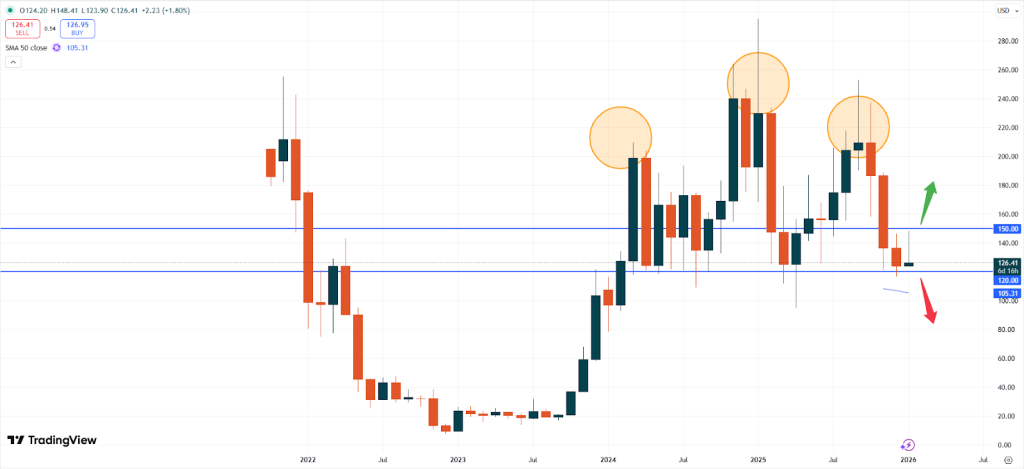
SOL – Solana is currently trading at USD 126.445. The trend of Soland remains bearish and the falling momentum is unbroken. Currently, the market seems to test the technical support zone of USD 120.00. A break of that level might unleash fresh selling pressure.
SOLUSD monthly chart
As we examined several times in the past, the bearish head- and- shoulders pattern is guiding this market. The technical resistance levels have not been retested and instead the market keeps fading further. Should the important support level be broken, there could be a rapid decline in price, which could push Solana towards the USD 25.00 price level.
Vantage does not represent or warrant that the material provided here is accurate, current, or complete, and therefore should not be relied upon as such. The information provided here, whether from a third party or not, is not to be considered as a recommendation; or an offer to buy or sell; or the solicitation of an offer to buy or sell any financial instruments; or to participate in any specific trading strategy. Any research provided does not have regard to the specific investment objectives, financial situation and needs of any specific person who may receive it. We advise any readers of this content to seek their own advice. Without the approval of Vantage, reproduction or redistribution of this information is not permitted.