US equities were losing momentum last week but ended trading on Friday with a strong rebound throughout the trading day. The positive sentiment has been picking up steam also in the crypto market, with most coins starting a rebound. As last week ended on a positive note, more upside momentum might follow this week.
Despite the Nasdaq technology index lagging behind the broader- based S&P 500 index, upside momentum can be observed as well. This might lead the positive sentient to continue.
Technical analysis:
– BTC: Bitcoin is trading at USD 69,621. Despite the fall below the psychological USD 70,000 level, the market might still be able to move higher again. With the technical candlestick pattern offering a potential positive move the upside might be open. Yet, the US data release should be taken into account as well. A weaker NFP report might cause the Fed to cut rates soon, while also falling consumer prices will help in similar way.
BTCUSD, weekly chart
If the price can break the technical resistance zone of USD 78,000 more upside might be seen. The markets might then resume its uptrend moving towards the USD 95,000 level again soon.
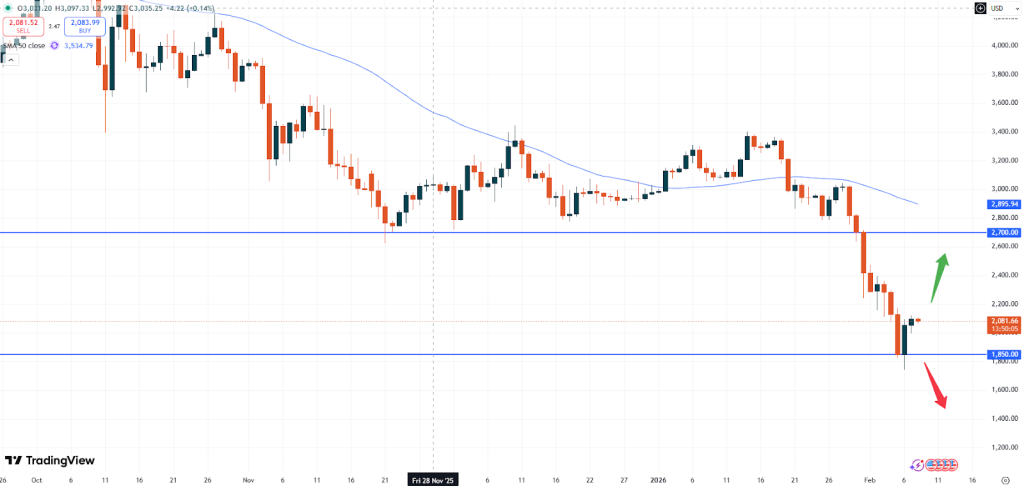
– ETH: Ethereum is currently trading at USD 2,081. The rebound of this token on Friday last week also followed the same path compared to Bitcoin but is still lagging behind based on long-term chart. Bitcoin is trading well above the 50- moving average based on the monthly chart, whereas Ether has fallen below that zone earlier this month.
ETHUSD, daily chart
However, the daily chart also looks constructive and might push the market higher for now. If the positive sentiment remains active, the market might test the previous USD 2,700 price level. A push below the USD 1,850 support zone on the other hand might cause the market to weaken again further.
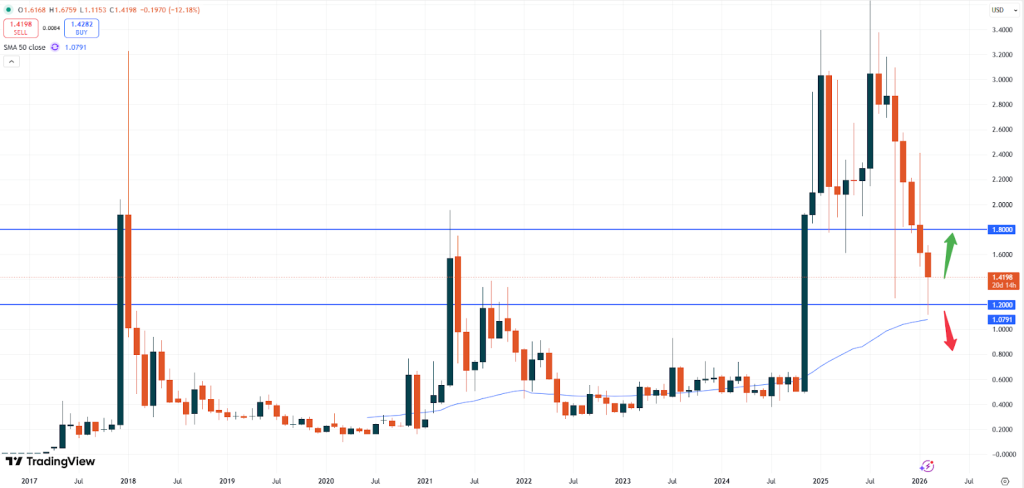
– XRP: Ripple is trading at USD 1.4196. The market has been trading lower this month and also fell below the previous important level of USD 1.8000. This zone was a major resistance zone in April 2021 and also acted as a support level several times last year. With the break below that level, traders will now focus on the USD 1.2000 level.
XRPUSD, monthly chart
If the price is able to stay above that level as the monthly chart above shows, more upside momentum might be seen. In fact, a quick break above USD 1.8000 might help pushing this market back up again. If on the other hand the 50- moving average level at around 1.0790 breaks, the slide in prices might continue quickly.
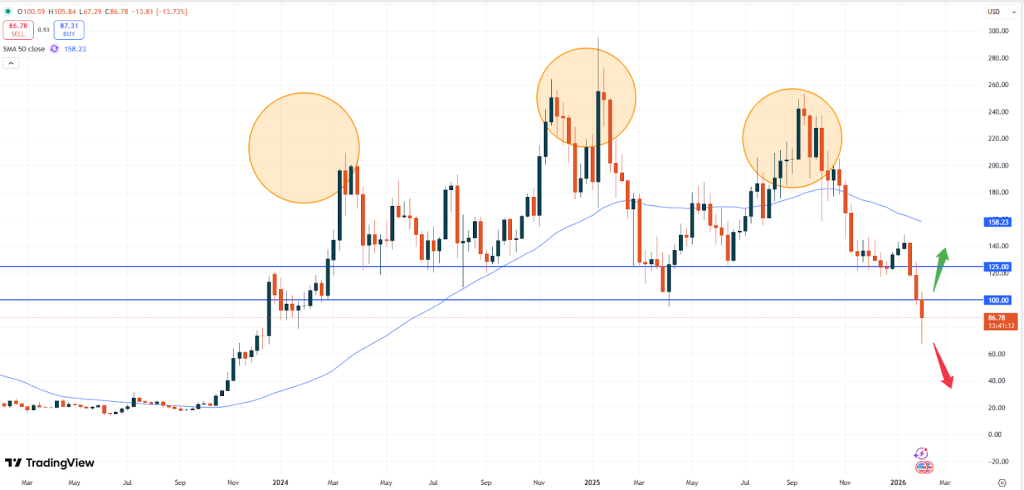
– SOL: Solana is trading at USD 86.71. Trading back below the psychological price level below the USD 100.00 zone might still remain negative for Solana. On the other hand, the market has also stopped falling again and might now start to rise further.
SOLUSD, weekly chart
Yet, as the weekly chart above shows, the previous support zone might act as a resistance now. Hence rising prices might face difficult times ahead, when testing the levels of USD 100.00 as well as the USD 125.00 level above. In any case the strong bullish trend might only gear up steam again above the 50- moving average level of 158.24.
Vantage does not represent or warrant that the material provided here is accurate, current, or complete, and therefore should not be relied upon as such. The information provided here, whether from a third party or not, is not to be considered as a recommendation; or an offer to buy or sell; or the solicitation of an offer to buy or sell any financial instruments; or to participate in any specific trading strategy. Any research provided does not have regard to the specific investment objectives, financial situation and needs of any specific person who may receive it. We advise any readers of this content to seek their own advice. Without the approval of Vantage, reproduction or redistribution of this information is not permitted.