The crypto market has long followed equities and in particular the Nasdaq technology index from the Unted States. Currently, the momentum in both assets remains different, though. While geopolitical tensions keep rising, also the Dollar is gearing up steam. On the other hand, the crypto market is gearing up some momentum. The recent decline of most tokens came to a pause and we like to assess potential reasons for that.
Bitcoin sold off about 8.5%, when the war with Iran began on a Saturday. Two weeks later, BTC has been outperforming mostly any other assets and has grown about 10%. Such moves were better than those in the S&P 500 and gold. Ony oil prices and the dollar had performed better in this context.
Technical analysis:
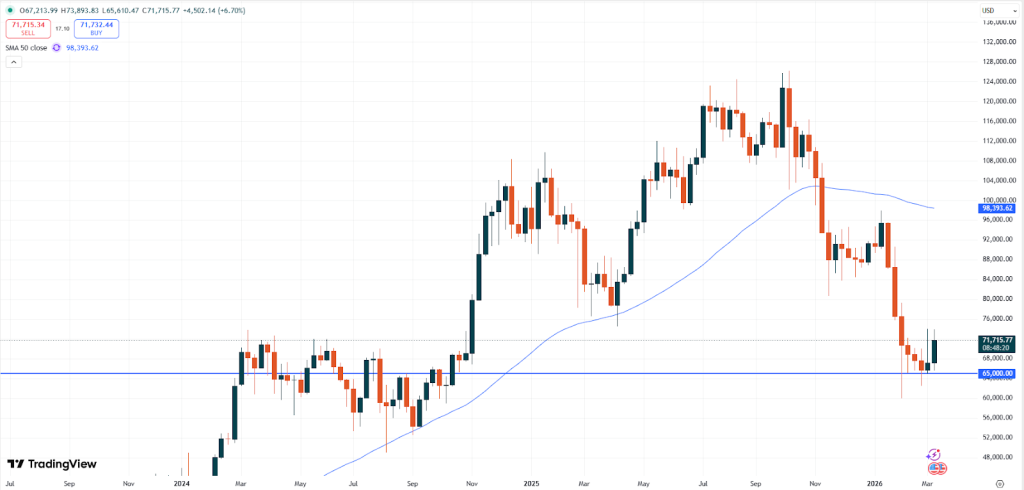
– BTC: Bitcoin is trading at USD 71,713. After the recent slide the markets started to rebound towards the end of last week. Having bounced off the technical support level of USD 65,000 the upside momentum might now continue. The recent positive sentiment, however, has come to a halt at around the USD 74,000 price level.
BTCUSD, weekly chart
The chart above shows that for two weeks in a row the market moved lower at this critical zone. If the price is able to trade above this price, which also marks a critical resistance level from March – October 2024 the upside momentum might start to build up steam again. This might then ignite another attempt for a fresh bullish breakout.
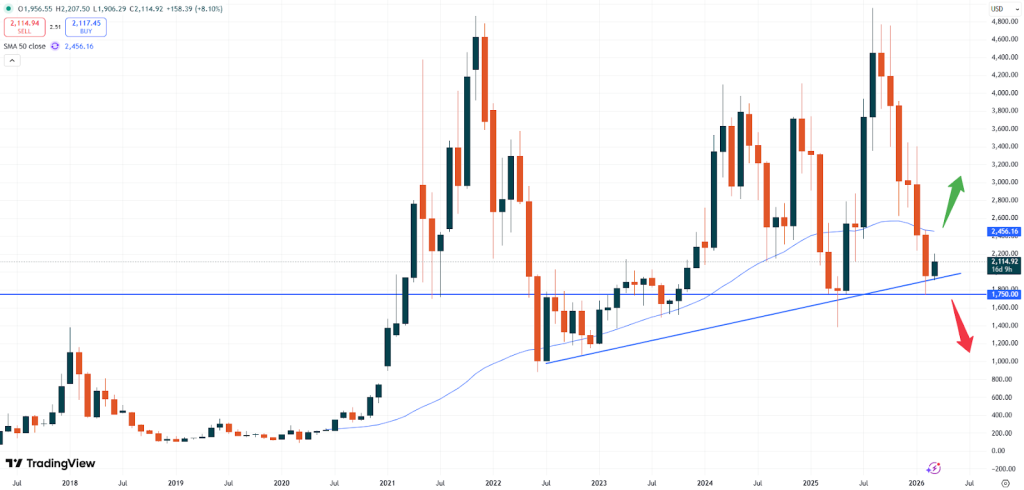
– ETH: Ethereum is trading at USD 2,114. Also, ETH keeps trading at elevated levels so far this month. The price seems to defend the important support zone of USD 1,750 which is crucial for the further market direction. A break of this zone might still cause the price to move lower, while a break of the 50- MA at USD 2,456 might ignite fresh upside momentum.
ETHUSD, monthly chart
The monthly chart above shows that any price above the rising trendline might still support the bullish argument for Ethereum following the long-term positive trend. However, if the price cannot rise above last month’s high, the positive sentiment could just as easily fade.
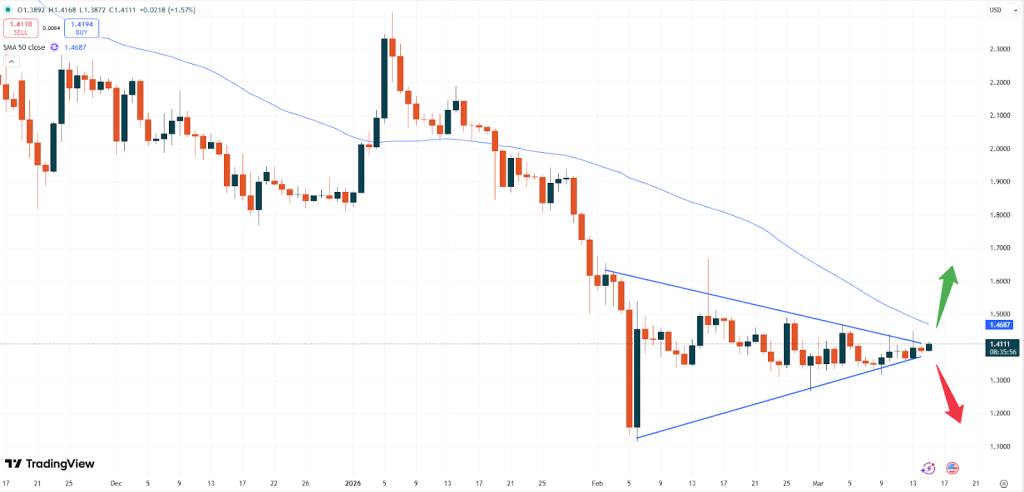
– XRP: Ripple is trading at USD 1.4110. The recent breakout of the triangle formation to the upside is still in the making and also XRP looks set to push higher for now.
XRPUSD, daily chart
While a break of the 50- MA at 1.4688 would ignite more bullish sentiment currently the upside momentum still looks constructive. In general, lower prices might be found only if the market will break below the long-term trend at around USD 1.3000.
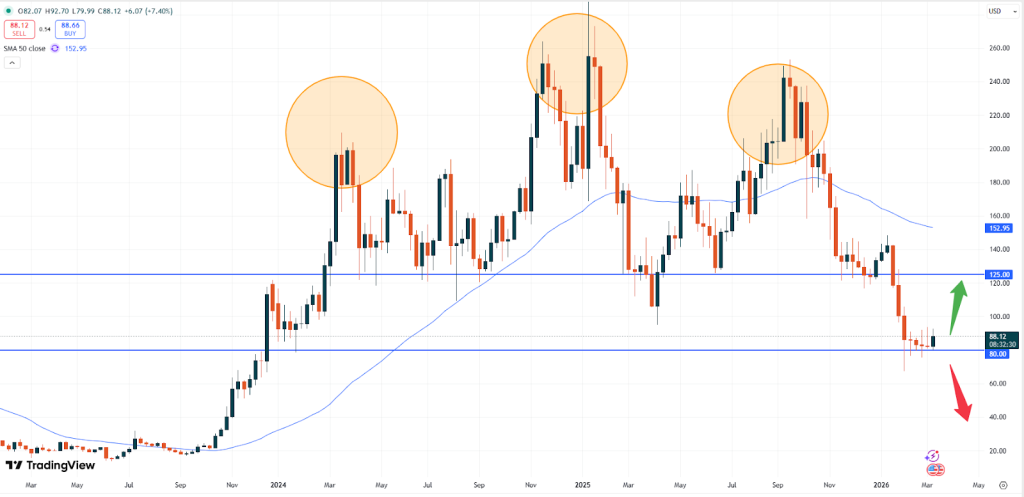
– SOL: Solana is trading at USD 88.13. Solana is also looking positive currently and keeps also following the pattern of Bitcoin. Despite the fact that Solana has not been able to break above the technical resistance level at around USD 93.00 the upside is currently building up steam.
SOLUSD, weekly chart
A break of the critical support level of USD 80.00 will push this market lower, based on the bearish sentiment. Unless this push lower occurs, traders might be better off looking for upside momentum towards the next resistance zone of USD 105.00.
Vantage does not represent or warrant that the material provided here is accurate, current, or complete, and therefore should not be relied upon as such. The information provided here, whether from a third party or not, is not to be considered as a recommendation; or an offer to buy or sell; or the solicitation of an offer to buy or sell any financial instruments; or to participate in any specific trading strategy. Any research provided does not have regard to the specific investment objectives, financial situation and needs of any specific person who may receive it. We advise any readers of this content to seek their own advice. Without the approval of Vantage, reproduction or redistribution of this information is not permitted.