After the recent positive trend in the crypto market most tokens keep pushing lower again. The new deadline, which had been set by President Trump to open the Straight of Hormuz cause Bitcoin to weaken, eradicating nearly USD 300 million in market valuations. If Iran does not open the sea passage within 48- hours, the US might strike Iran’s power plants.
Overall sits the recent Central Bank action. The war against Iran, which should be expected to drive general prices higher and hence most Banks left their rates unchanged at higher levels in order to curb inflation. A potentially stronger Dollar might help to keep prices at bay even towards the end of this year.
Technical Analysis
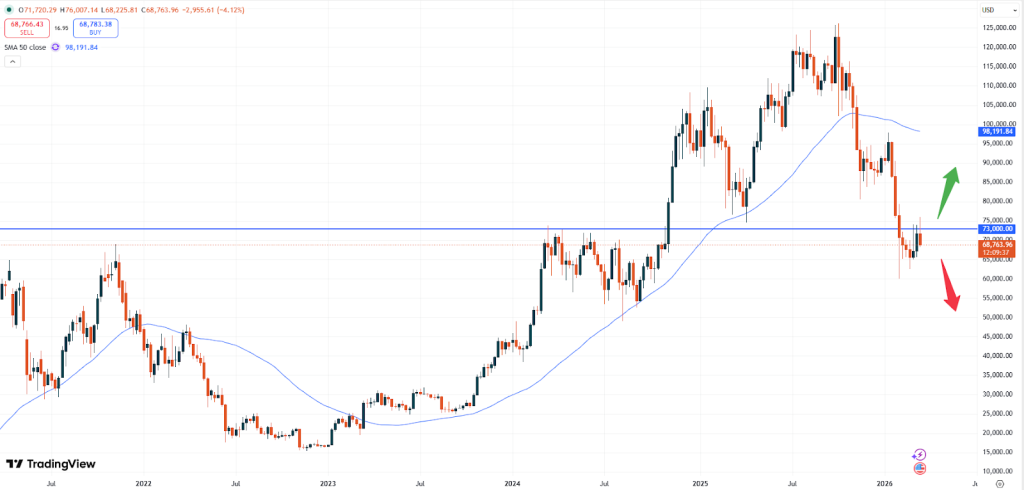
BTC – Bitcoin is trading at USD 68,763. The recent technical support zone at USD 65,000 seems to hold for now and the market keeps pushing somewhat higher. Yet, the generally positive risk sentiment in markets is fading. This also causes the price of Bitcoin to potentially weaken eventually, if investors continue to pull out funds.
BTCUSD weekly chart
On the other hand, as long as the market is trading above this support zone more upside momentum might also be seen. Should the Dollar weaken again, this might push BTC towards the USD 80,000 price level. In order to remain positive, the USD 65,000 zone should then not give way to move the market higher.
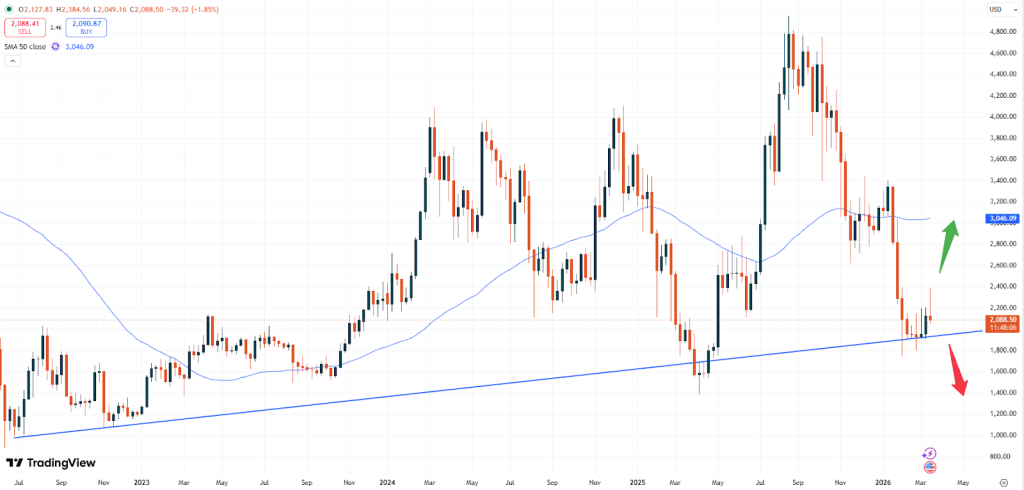
ETH – Ethereum is currently trading at USD 2,088. Also, Ethereum has been in a positive trend and continued moving higher in the recent three weeks. Yet, since profit taking mostly set in over the weekend, the upside momentum has been curbed pushing the market back to the sideways trading range again.
ETHUSD weekly chart
Unless the market breaks the rising trendline, which currently sits at USD 1,955 the upside momentum might gear up steam again. Traders might look into fresh buying opportunities above the USD 2,400 price target. This level has been the major resistance from last week.
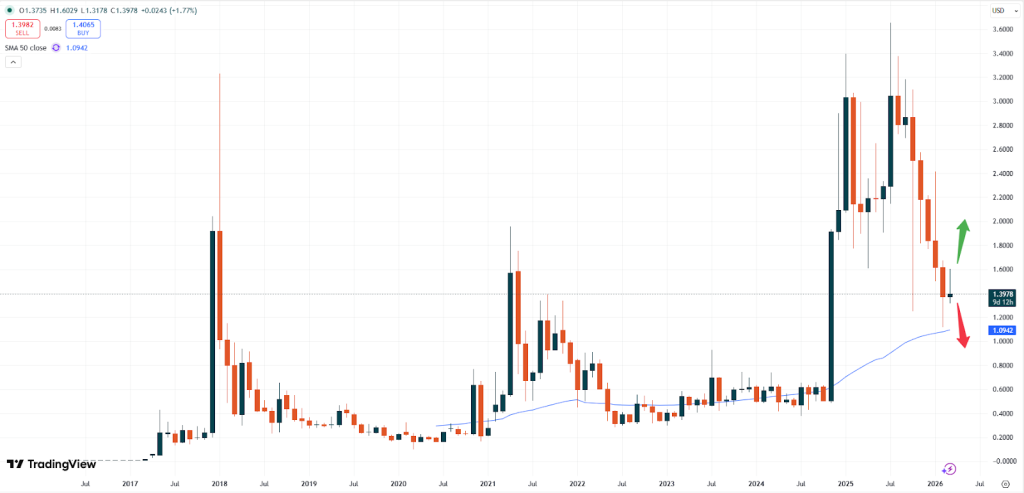
XRP – Ripple is currently trading at USD 1.3976. Based on the monthly chart below Ripple has not been able to move higher. After having tested the level of USD 1.6000 early this month, the negative momentum came back to this market.
XRPUSD monthly chart
Traders should observe the level of USD 1.3250. A break of this zone, which is slightly below the lowest prices for the month might indicate fresh selling opportunities. XRP might then continue to fall towards the 50- moving average area at about 1.0940. Seasonal data might also underline this negative sentiment, which might continue in the coming months ahead.
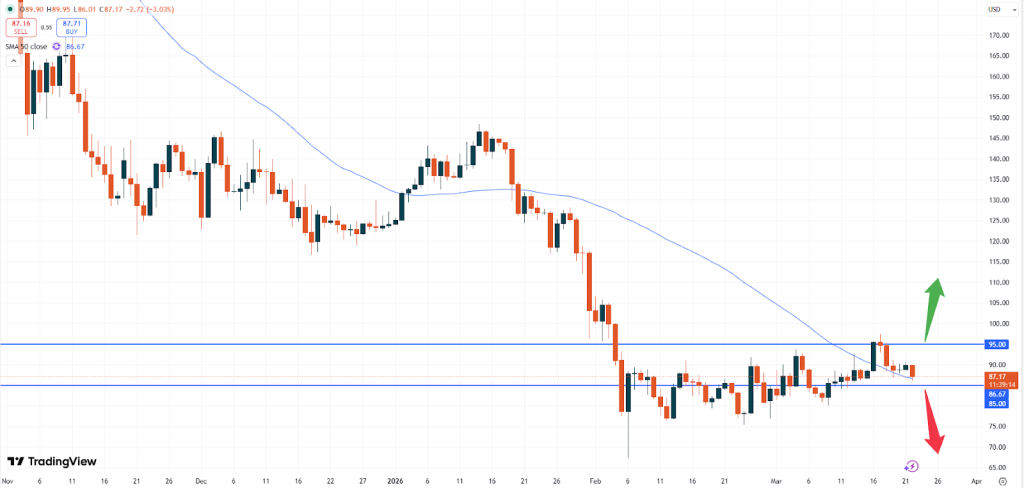
SOL – Solana is currently trading at USD 87.16. The negative sentiment has seemingly taken over market momentum again. After the initial positive move early last week, prices have been sliding alongside the generally negative sentiment in marktes.
SOLUSD daily chart
While a break above the USD 95.00 level is needed in order to offer fresh upside momentum a break below the USD 85.00 seems rather likely currently. The general trend of Solana remains very negative and the token is currently testing the 50- moving average zone, which can be used as guidance in the short- term.
Vantage does not represent or warrant that the material provided here is accurate, current, or complete, and therefore should not be relied upon as such. The information provided here, whether from a third party or not, is not to be considered as a recommendation; or an offer to buy or sell; or the solicitation of an offer to buy or sell any financial instruments; or to participate in any specific trading strategy. Any research provided does not have regard to the specific investment objectives, financial situation and needs of any specific person who may receive it. We advise any readers of this content to seek their own advice. Without the approval of Vantage, reproduction or redistribution of this information is not permitted.