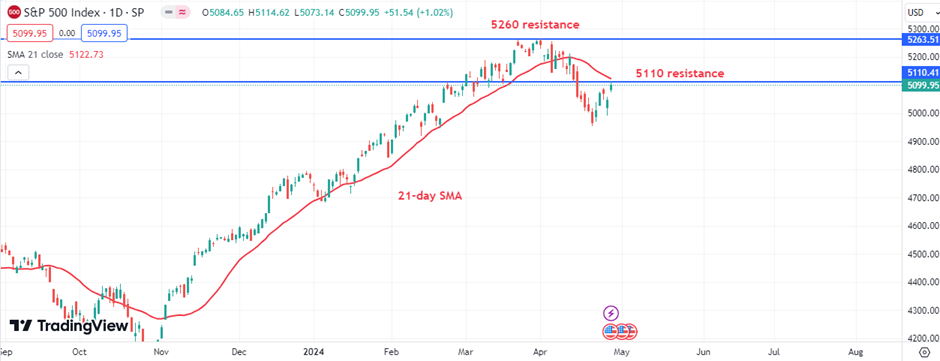
-The S&P 500 has reached a critical resistance point at 5110, coinciding with the 21-D moving average, signaling potential entry points for sellers.
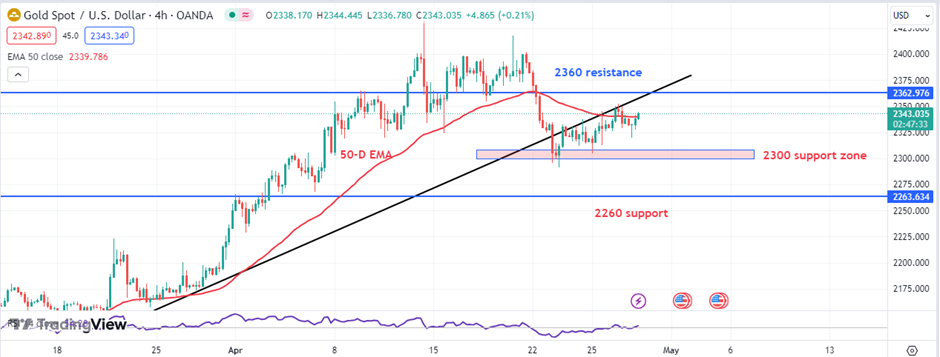
-XAUUSD shows a bearish bounce on the 4-H chart after retesting a broken bullish trendline, with potential further declines if it breaks below the 2300 support level.
US (USD): Fed Interest Rate Decision
Federal Open Market Committee (FOMC) members vote on where to set the rate. Traders watch interest rate changes closely as short term interest rates are the primary factor in currency valuation.
A higher than expected rate is positive/bullish for the USD, while a lower than expected rate is negative/bearish for the USD.
The previous reading was 5.50% same as forecast. The next report is due on May 01, 2024 at 18:00 GMT. Its forecast also stands at 5.50%.
S&P 500 Technical Analysis:
In the daily market chart, the S&P 500 has hit a crucial resistance point at 5110. This level is significant as it coincides with the 21-D moving average. At this junction, sellers are likely to enter the market, aiming to capitalize on potential declines from this point.
Conversely, buyers are watching for the price to break above this level and the 5260 resistance. This move which would challenge the current bearish outlook and potentially set the stage for a push towards new all-time highs.
Pivot Points: S&P 500
Support
Resistance
S1
5006
R1
5073
S2
4965
R2
5099
S3
4939
R3
5141
US (USD): U.S. Nonfarm Payrolls
Nonfarm Payrolls measures the change in the number of people employed during the previous month, excluding the farming industry. Job creation is the foremost indicator of consumer spending, which accounts for the majority of economic activity.
A higher than expected reading should be taken as positive/bullish for the USD, while a lower than expected reading should be taken as negative/bearish for the USD.
The previous actual data was 303K more than the forecast of 212K. The upcoming report is due on May 03, 2024 at 12:30 GMT and its forecast figure stands at 243K.
XAUUSD Technical Analysis:
On the 4-H chart, XAUUSD prices have recently shown a bearish bounce after retesting a previously broken bullish trendline.
For a further decline to be confirmed, the price would need to break below the 2300 support level, potentially targeting 2260 as the next corrective milestone. The price is also being influenced by bearish pressure from the 50-D EMA indicator.
However, it is important to note that if price breaks above 2360, this could halt the expected downturn and prompt a recovery back into the main bullish trend.
Top of Form
Pivot Points: XAUUSD
Support
Resistance
S1
2333
R1
2337
S2
2330
R2
2339
S3
2328
R3
2342
Vantage does not represent or warrant that the material provided here is accurate, current, or complete, and therefore should not be relied upon as such. The information provided here, whether from a third party or not, is not to be considered as a recommendation; or an offer to buy or sell; or the solicitation of an offer to buy or sell any financial instruments; or to participate in any specific trading strategy. Any research provided does not have regard to the specific investment objectives, financial situation and needs of any specific person who may receive it. We advise any readers of this content to seek their own advice. Without the approval of Vantage, reproduction or redistribution of this information is not permitted.
Vantage does not represent or warrant that the material provided here is accurate, current, or complete, and therefore should not be relied upon as such. The information provided here, whether from a third party or not, is not to be considered as a recommendation; or an offer to buy or sell; or the solicitation of an offer to buy or sell any financial instruments; or to participate in any specific trading strategy. Any research provided does not have regard to the specific investment objectives, financial situation and needs of any specific person who may receive it. We advise any readers of this content to seek their own advice. Without the approval of Vantage, reproduction or redistribution of this information is not permitted.