Crypto markets continue to follow the US stock market. In particular big tech like the Magnificent- 7 seem to be a preview of what might follow ahead in the crypto world. With the rise of DeepSeek from China US tech is losing some steam and most tokens seem to follow this trend. The correction on Friday caused equites to weaken following the weaker than expected NFP data. Does this now mean cryptos will continue to run lower?
Technical analysis:
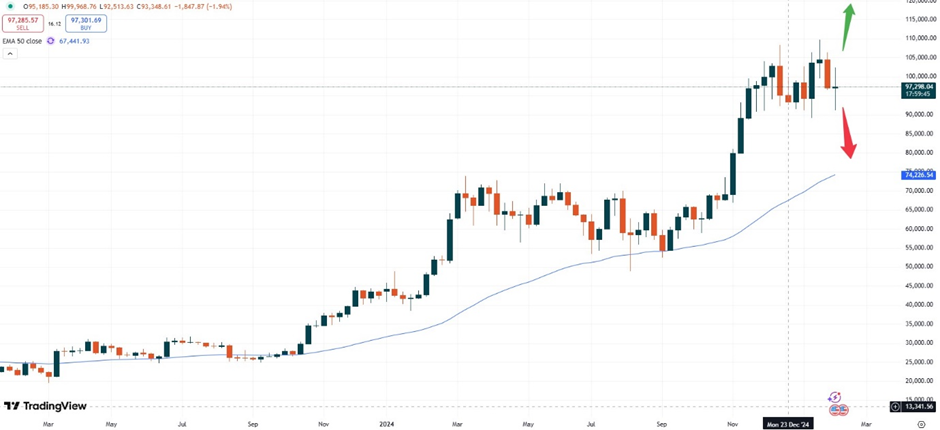
– BTC: Bitcoin is trading at USD 97,298 and has been ending last week in sideways pattern, indicated by the doji candlestick based on the weekly chart. The recent technical resistance zone at around the USD 108,500 level still prevents the market from breaking to the upside.
The chart above shows that only a break above that zone will unleash further upside momentum. Currently lower prices should be factored in and might act as buying opportunities. The next major support zone comes into play at around USD 72,000, where also the rising 50- moving average would act as support.
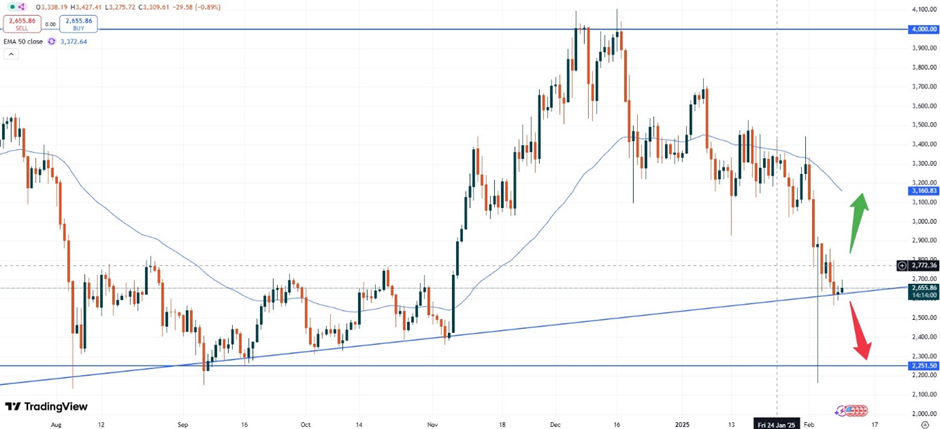
– ETH: Ethereum is trading at USD 2,663.00. The bearish sentiment continues to impact this market whereas the potential bearish momentum of BTC might help Ethereum. This market often does better when Bitcoin falls. The daily chart below also shows that a slight rising trendline might help the token to move higher.
Furthermore, the positive pinbar candlestick from the 03rd of February would support rising prices towards the USD 3,200.00 level. A break of this important area would cause the downtrend to continue.
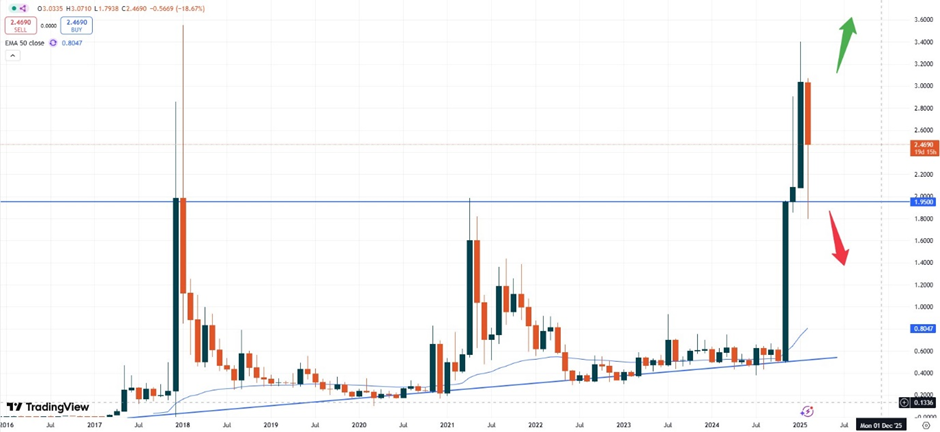
– XRP: Ripple is trading at USD 2.4800. The price of the token had dropped nearly 40% from its previous levels below the USD 1.8000 zone. Since then, the market had been able to recover sharply again.
Based on the long- term monthly chart, however, the price momentum might still remain volatile. No clear direction can be determined for now whereas the sharp rise towards the USD 3.4000 level before opens questions for a sustainable uptrend. Traders might be better off using lower levels for entries in this market. The USD 1.9500 area might offer further guidance. Another break of that zone might unleash more downside momentum at first.
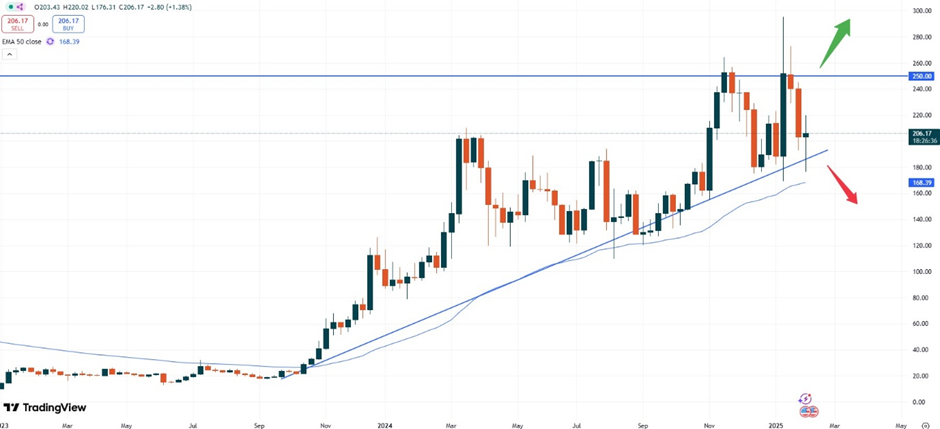
– SOL: Solana is trading at USD 206.35. The general trend still looks positive with the market potentially ready to run higher. The weekly chart also remains on top of the rising support zone.
The price is trading away from the 50- moving average as well as on top of the recent resistance area from end of march 2024. This zone would now act as a support zone if not broken to the downside. For a sustainable uptrend, the price should break the technical resistance at USD 250.00. A break of this area could be used for fresh entry opportunities.
Vantage does not represent or warrant that the material provided here is accurate, current, or complete, and therefore should not be relied upon as such. The information provided here, whether from a third party or not, is not to be considered as a recommendation; or an offer to buy or sell; or the solicitation of an offer to buy or sell any financial instruments; or to participate in any specific trading strategy. Any research provided does not have regard to the specific investment objectives, financial situation and needs of any specific person who may receive it. We advise any readers of this content to seek their own advice. Without the approval of Vantage, reproduction or redistribution of this information is not permitted.