With the slide of US equities and in particular the tech market also the crypto market remains shaky for the time being. Bitcoin had tumbled below the USD 80,000.00 briefly and remains under pressure. The bearish sentiment might continue in particular with many traders investing in the markets using leverage. Should their margins not be sufficient to hold positions, traders might need to liquidate position, which would add to the bearish selling pressure. Should the slide in particular in Bitcoin continue, also altcoins would face substantial selling pressure.
Positive sentiment might come back to markets with Donald Trump stating that he would opt for a crypto summit. Also, BlackRock might offer positive news as they like to add Bitcoin as well to their model portfolio.
Technical analysis:
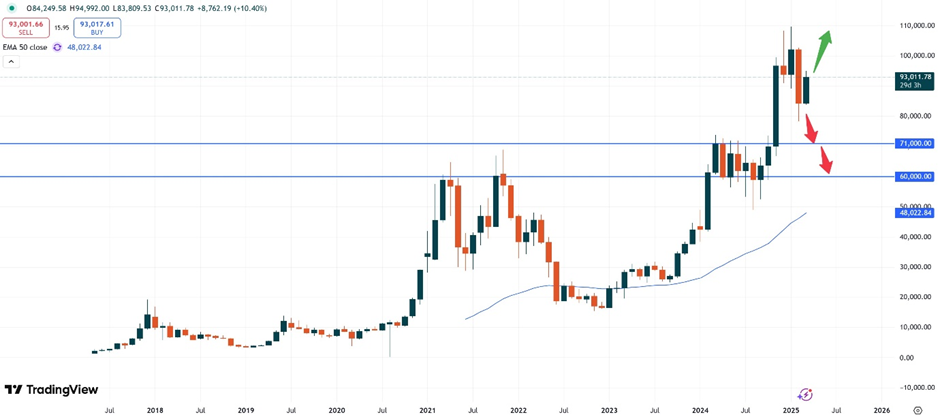
– BTC: Bitcoin is trading at USD 93,011. The price fell sharply last week and left the recent sideways trading zone to the downside towards the end of February. The pressure in this market might extend as the monthly chart below suggests. The important next support lines at USD 71,000 and USD 60,000 might be new targets, where the market could find next support.
The slight move higher currently might just be a retracement which can usually be found during the first trading days of a new month before the bearish pressure increases again.
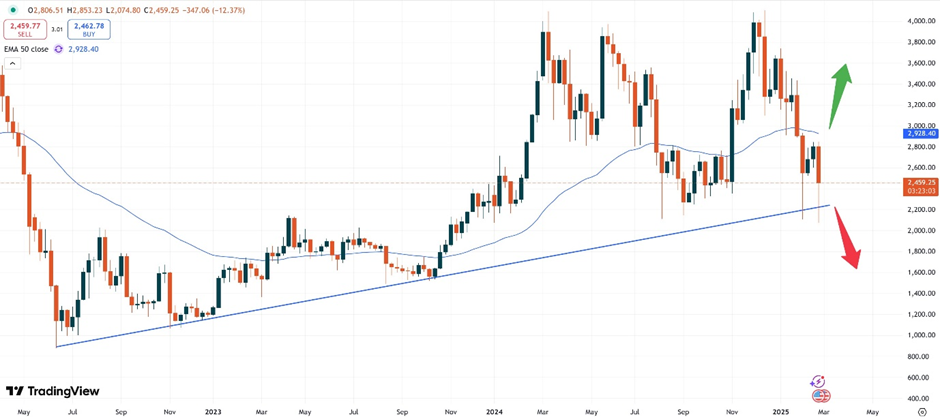
– ETH: Ethereum is currently trading at USD 2,459.25. Similarly to Bitcoin also the second biggest token in the crypto space lost sharp momentum.
The weekly chart above shows, that the support zone at USD 2,500.00 did not offer much support as the market fell sharply last week. Further selling pressure might now follow. Should the rising trendline also give way, the market might fall towards the psychological USD 2,000.00 price level if not even lower.
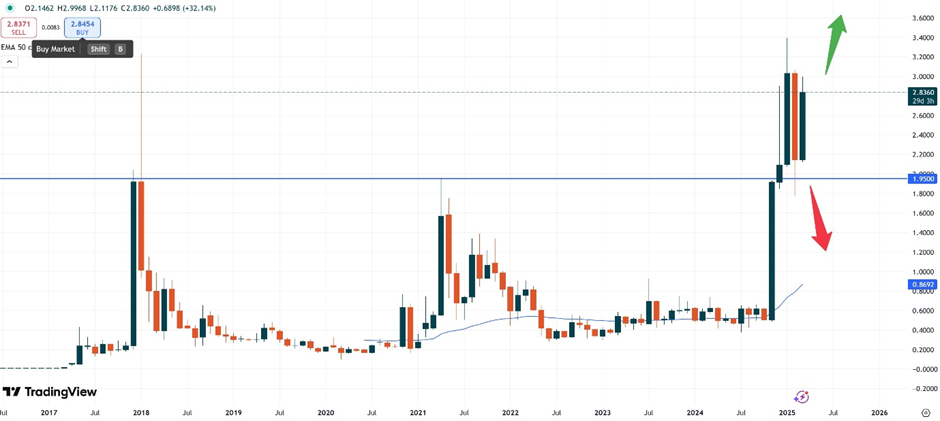
– XRP: XRP is currently trading at USD 2.8360. The market finally seems to be ready to also give way as previously anticipated. The recently strong (parabolic) uptrend has now given way and the price looks set to continue towards lower levels.
The technical resistance zone at USD 1.9500 will now be of significant importance. Should also this zone break the market might be ready to fall towards the USD 1.6000 price range. The two price points from January 2018 as well as April 2021 clearly show how prices had behaved in the past after extreme price levels in this market were created. Further losses should be anticipated before entering into fresh buy positions.
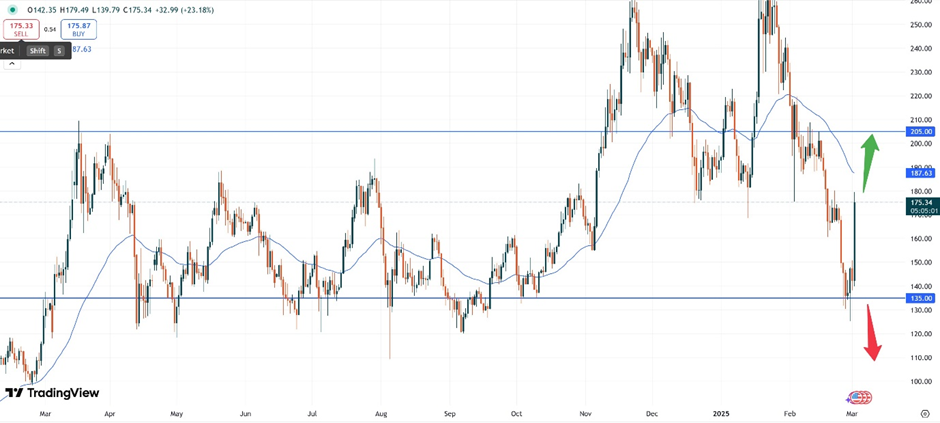
– SOL: Solana is currently trading at USD 175.34 and has also extended its slide during last week’s trading. Based on the daily chart below the market has now stabilized at an important support level. If the zone at USD 135.00 won’t break, the market might continue to rise during this week’s trading.
Upside momentum might then be found towards the next technical resistance zone at USD 205.00. Yet, the weekly chart might paint a different picture: the price of Solana can be found already trading well below the important 50- moving average.
Vantage does not represent or warrant that the material provided here is accurate, current, or complete, and therefore should not be relied upon as such. The information provided here, whether from a third party or not, is not to be considered as a recommendation; or an offer to buy or sell; or the solicitation of an offer to buy or sell any financial instruments; or to participate in any specific trading strategy. Any research provided does not have regard to the specific investment objectives, financial situation and needs of any specific person who may receive it. We advise any readers of this content to seek their own advice. Without the approval of Vantage, reproduction or redistribution of this information is not permitted.