Crypto markets resumed strong upside momentum towards the end of last week. Following the initial positive market sentiment of the Nasdaq, markets started to rally towards higher levels. The price of Bitcoin is on its way towards higher levels and might be able to test the technical zone of USD 120.000 soon. Measured in Euro on the other hand, the price still remains below its all- time- high, due to the strength of the EUR. Altcoins have also started to follow with fresh upside. The positive sentient can be seen in most tokens, as traders might also shift away from equities towards digital assets currently. Furthermore, recent announcement by Donald Trump that new tariffs in volume of 30% will be imposed on Mexico and the EU did not shake up markets. Instead, this week might offer more clarity for crypto markets, which seem resilient to current fundamental news.
Technical analysis:
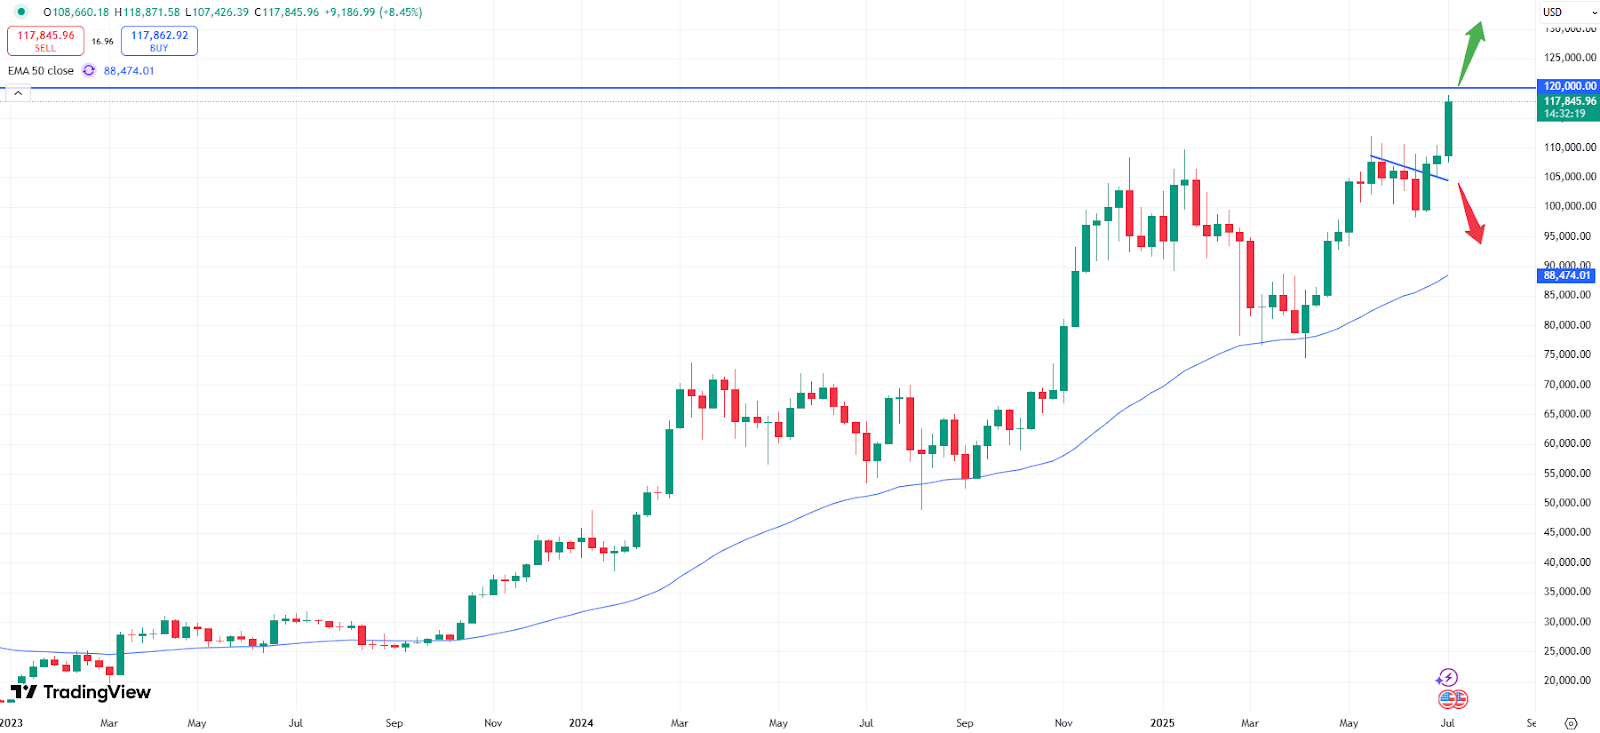
– BTC: Bitcoin is trading at USD 117,847. Bitcoin was able to break the recently created all- time- high from the month of may and seems to be well on track to move towards higher levels. Should the psychological resistance level at USD 120,000 break, more upside might be seen.
BTCUSD, weekly chart
The weekly chart above shows that the positive sentiment might now offer further upside momentum. Each time the market broke away from a previous high, much more upside has been observed and it might be the same also this time again.
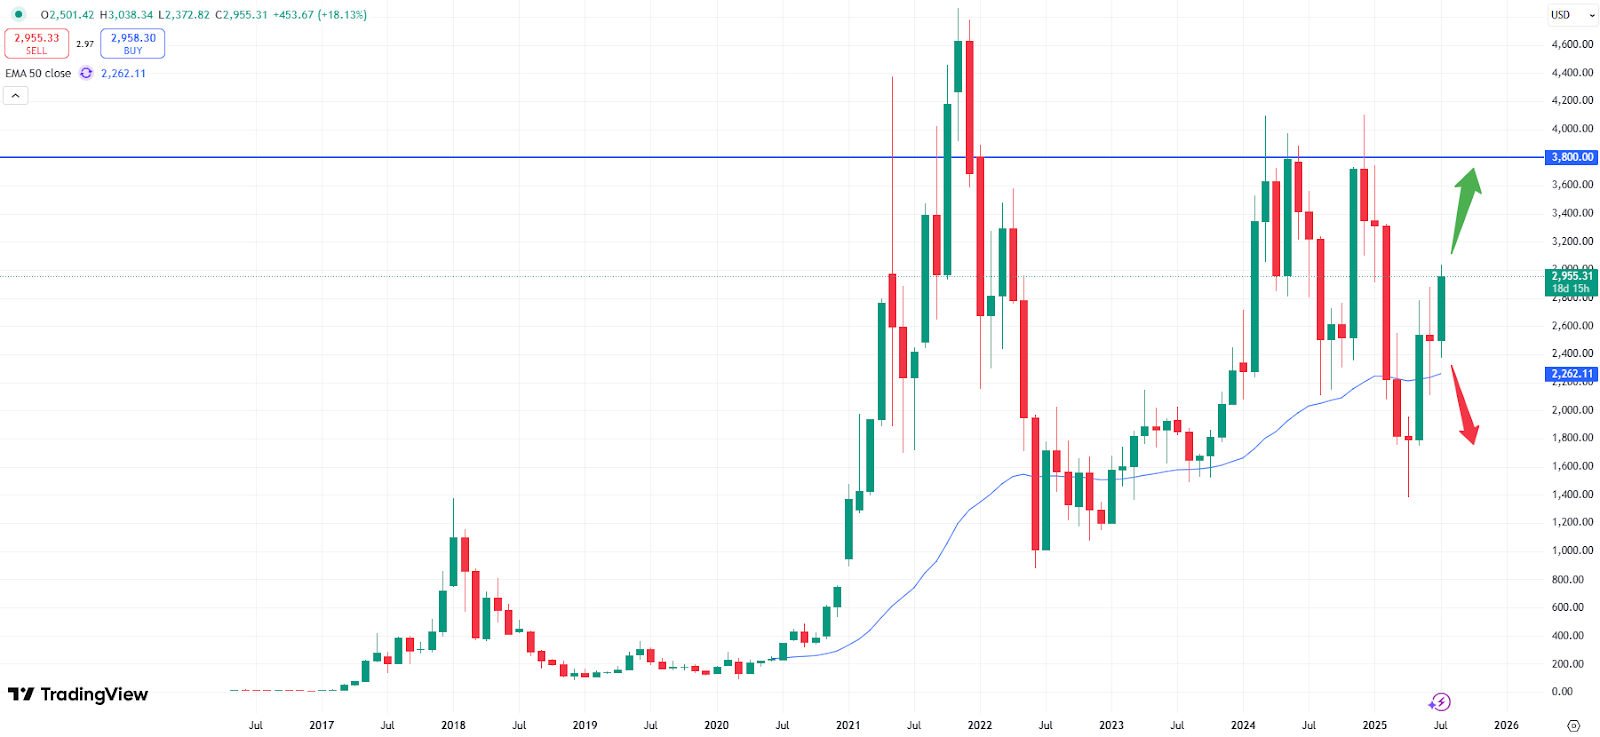
– ETH: Ethereum is currently trading at USD 2,956. Similarly to BTC also ETH was able to march higher. The positive sentiment might now continue as well. By breaking away from the technical resistance zone at USD 2,800 the sentiment has changed and positive momentum might now be on the cards.
ETHUSD, monthly chart
However, the strong sentiment might only get more traction above the technical area at USD 3,800. A break of that zone would then quickly pave the way towards the USD 4,600 range. Some headwinds might now be observed at the USD 3,000 level as well.
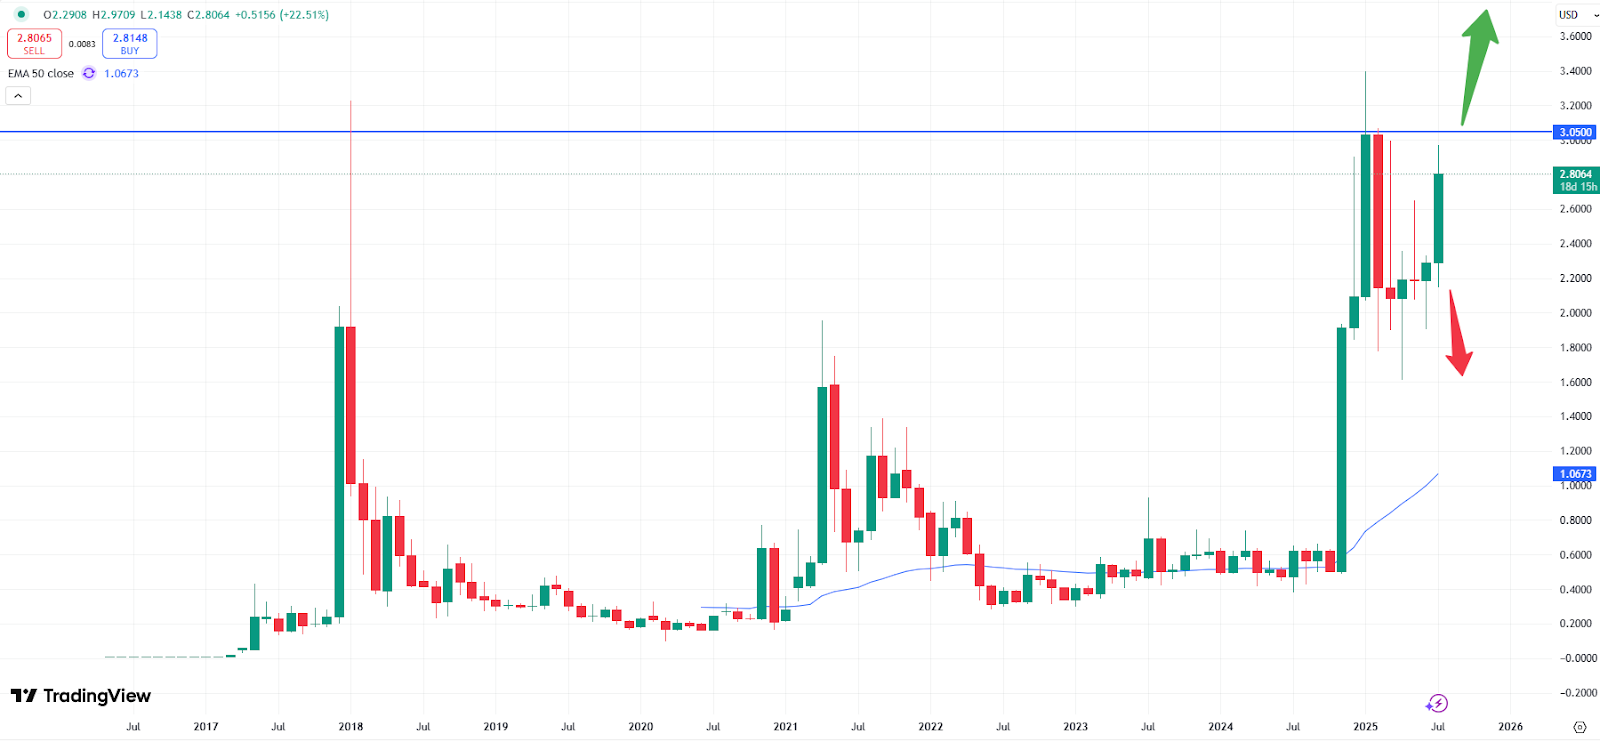
– XRP: Ripple is trading at USD 3.0500. Also Ripple seems to be able to create more upside momentum currently. By nearing the technical resistance level at 3.0500 the change in direction can now be observed. Fresh upside might be seen if that zone breaks.
XRPUSD, monthly chart
The upside might be limited, though. If the market falls back now history shows what could happen. Compare the price development with the moves in August 2021. Back then the market also started to move higher but failed to break the USD 1.5500 level, causing the positive trend to evaporate.
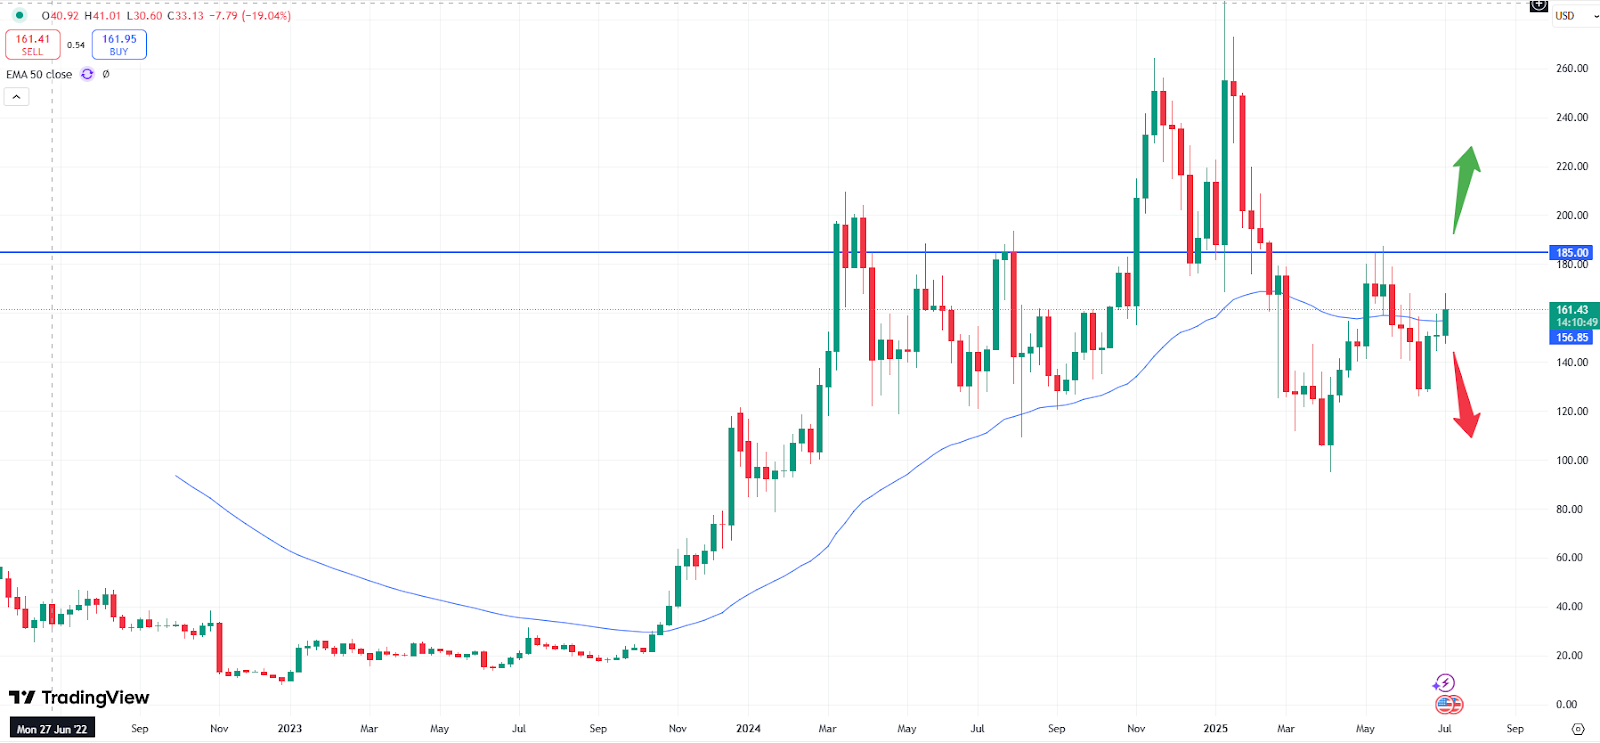
– SOL: Solana is trading at USD 161,36. Of all the observed tokens this one keeps lagging behind. The market remains seemingly capped near the 50- moving average based on the weekly chart below.
SOLUSD, weekly chart
Only a break of the technical resistance zone at USD 185.00 would open up more momentum towards the USD 250.00 range. Alongside the other tokens moving higher, Solana might still get more upside as well. If the altcoin season comes into play also Solana might hence profit from the positive sentiment.
Vantage does not represent or warrant that the material provided here is accurate, current, or complete, and therefore should not be relied upon as such. The information provided here, whether from a third party or not, is not to be considered as a recommendation; or an offer to buy or sell; or the solicitation of an offer to buy or sell any financial instruments; or to participate in any specific trading strategy. Any research provided does not have regard to the specific investment objectives, financial situation and needs of any specific person who may receive it. We advise any readers of this content to seek their own advice. Without the approval of Vantage, reproduction or redistribution of this information is not permitted.