Following the statements of US President Trump, that he will impose further tariffs over China, US equities were losing sharp momentum during Friday’s trading. The correction in markets also caused the crypto space to weaken. Big differences can be observed in the different tokens, which we will examine below. Some tokens lost sharp momentum, while others were able to regain the majority of their slide. Bitcoin lost as much as USD 7 billion in a flash- crash, causing the token to weaken 10% on Friday last week.
The opening of the US stock market will likely offer more clarity in upcoming moves. A potential rise in prices might also help the crypto market, while another slide in prices will likely extrapolate losses.
Technical analysis:
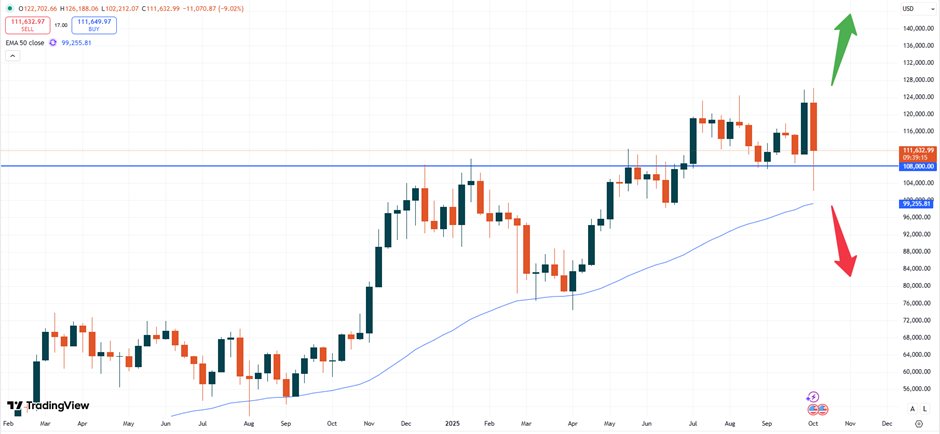
– BTC: Bitcoin is trading at USD 111,633. Based on the weekly chart the price lost sharp momentum during Friday’s trading last week. Yet, fresh buyers stepped in which helped, causing the market to continue trading above the important support zone of USD 108,000. Only a major break of that zone might cause the negative momentum to continue.
BTCUSD, weekly chart
Below that zone also the 50- moving average at USD 99,260 would follow as a potential support zone. Positive momentum might hence help if prices will move lower this week.
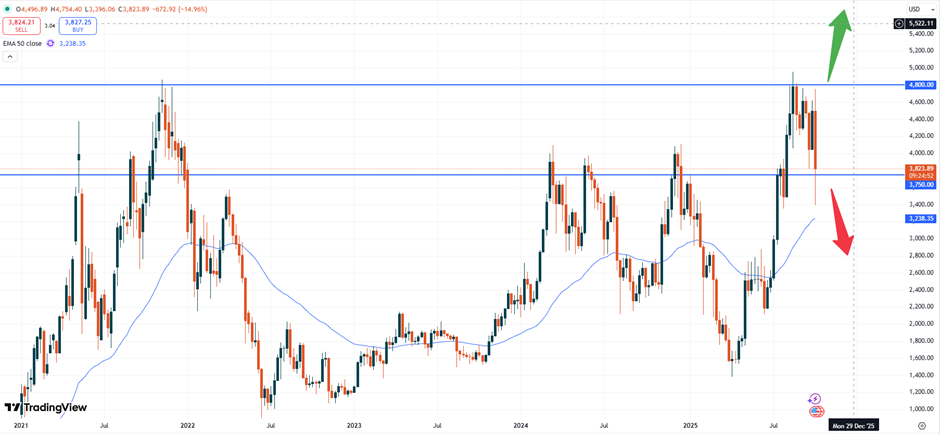
– ETH: Ethereum is currently trading at USD 3,826. The slide in this token looks bigger, as seemingly traders remain unclear about the potential future move of the currency.
ETHUSD, weekly chart
Should the strong support zone at 3,750 break based on the weekly chart, the market might weaken further. Traders should then expect another push down towards the early 3,000 range if not even towards lower prices.
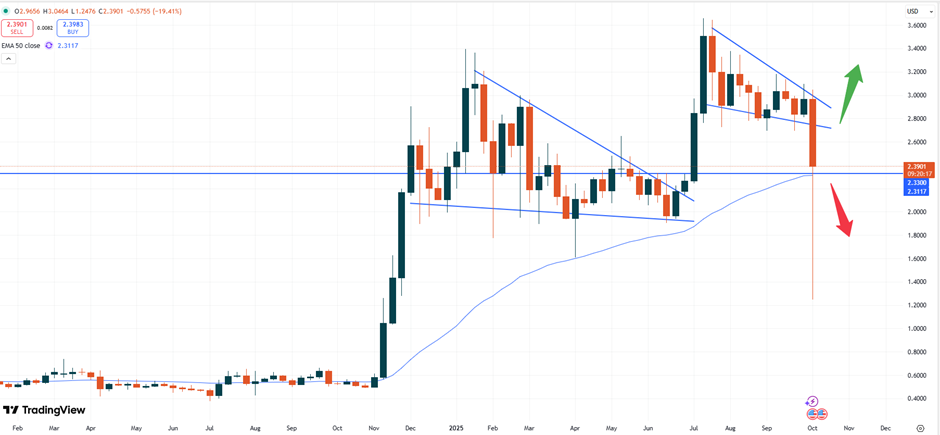
– XRP: Ripple is trading at USD 2.3900. This token looks the weakest in all examined currencies today. Following Trump’s statements XRP briefly tumbled down towards the USD 1.3000 price level. Leveraged trades at high stakes likely caused inexperienced traders to reduced their positions, while also trading platforms might have cut positions with high leverage in order to protect clients.
XRPUSD, weekly chart
The weekly chart above shows, that a strong rebound also showed fresh buying power. Now the focus should be on the important support zone at USD 2.3300. Another break of the zone might indicate that the slide will continue. Furthermore a push above the level of USD 3.0000 is needed in order to continue with the bullish momentum.
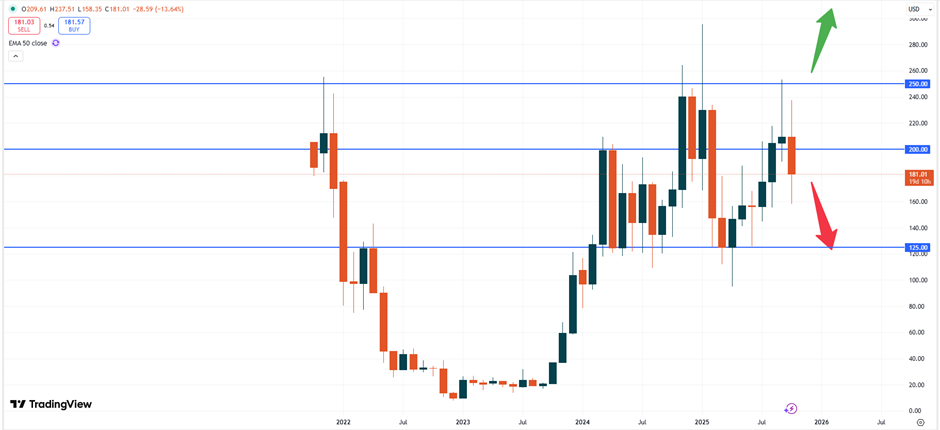
– SOL: Solana is trading at USD 181.00. The slide in prices follows the exact charting pattern of last month. At the end of trading in September, Solana was weakening further indicating a potential slide in prices as we stated before.
SOLUSD, monthly chart
The bearish pinbar candlestick pattern from September was a warning sign for traders, that falling prices might emerge. So, the current slide below the USD 200.00 price tag might now indicate that the bullish sentiment might fade for now. Traders should now focus on the price action. If the price can stabilize above the USD 150.00 level the momentum might intensify again.
Vantage does not represent or warrant that the material provided here is accurate, current, or complete, and therefore should not be relied upon as such. The information provided here, whether from a third party or not, is not to be considered as a recommendation; or an offer to buy or sell; or the solicitation of an offer to buy or sell any financial instruments; or to participate in any specific trading strategy. Any research provided does not have regard to the specific investment objectives, financial situation and needs of any specific person who may receive it. We advise any readers of this content to seek their own advice. Without the approval of Vantage, reproduction or redistribution of this information is not permitted.