Despite US equities having resumed upside momentum the general trend of the crypto market seems negative. Usually, cryptos follow upside momentum, in particular with the focus of the Nasdaq technology index. Yet, currently the momentum remains bearish and all observed tokens don’t look like they will try to run higher these days. On the other hand, recent losses of XRP and Solana remain limited and might indicate that the rally just faces a pause for now.
Technical analysis:
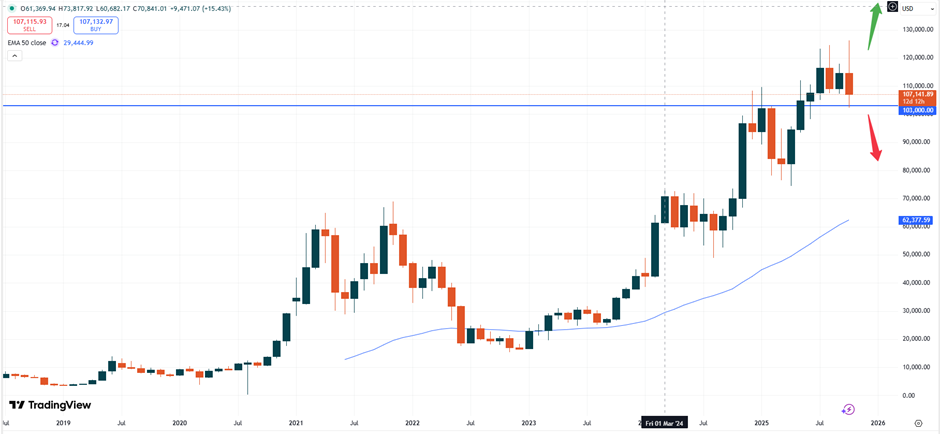
– BTC: Bitcoin is trading at USD 107,142. The market currently looks bearish as the monthly candlestick pattern below suggests but also keeps trading above the psychological USD 100,00 price level. If the USD 103,000 handle will not break some upside momentum might be observed.
BTCUSD, monthly chart
The important support level in blue color above shows that the market seems to test the uptrend for now before being potentially ready to move higher. Traders might be better off waiting for the uptrend to re- emerge again. Buying above the high at the USD 118,000 range might offer a better chance to catch renewed momentum towards higher prices.
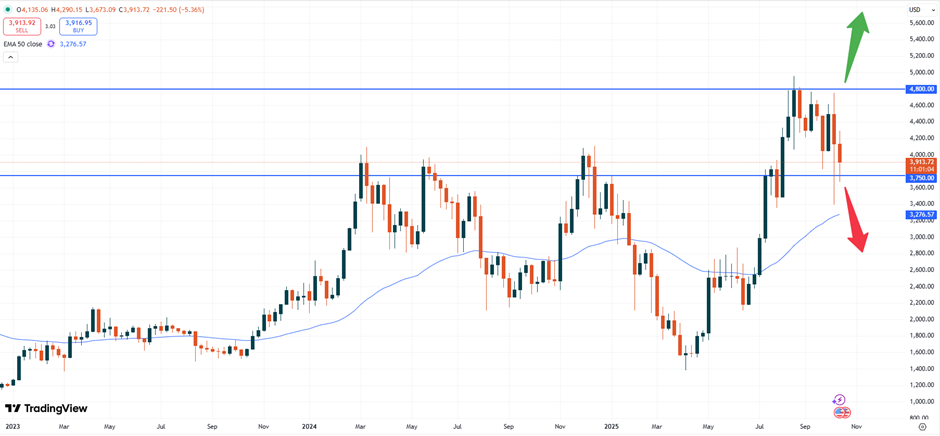
– ETH: Ethereum is trading at USD 3,915. The market broke below the psychological price level of USD 4,000. Such move might indicate that further losses should now be factored- in.
ETHUSD, weekly chart
The weekly chart above shows, that the uptrend failed to generate positive momentum after the test of the USD 4,000 level and hence caused prices to slide further. On the other hand, prices have not been falling further and ETH keeps trading above the support zone of USD 3,750. A renewed break of that level might cause the market to fall towards the 50- moving average, which currently sits at USD 3,276 before the market might rise further.
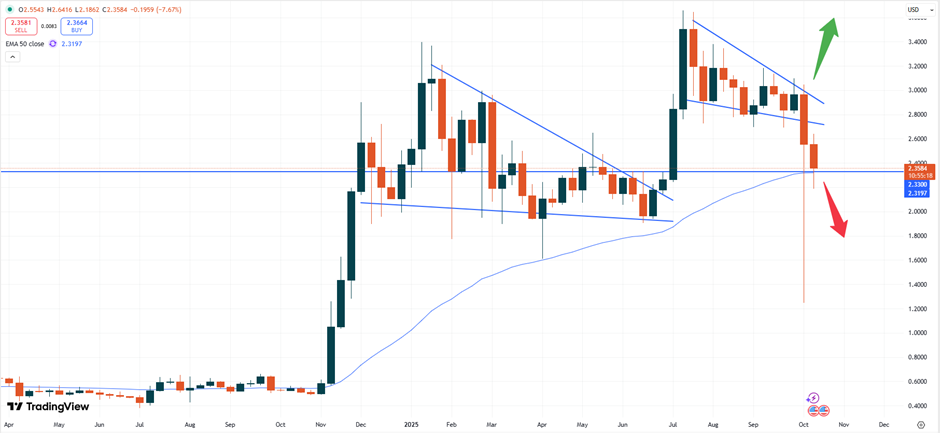
– XRP: Ripple is trading at USD 2.3551. Following the flash- crash two weeks ago the market has been able to recover ground again. Yet, last week the price was not able to gear up steam again with the market remaining in a sideways pattern.
XRPUSD, weekly chart
The weekly chart above shows that a break of the psychological USD 3.0000 level is needed to generate fresh upside momentum. If that zone breaks new buyers might step in quickly causing the bullish trend to re-emerge. Currently, though, the market sits at an important support zone. The 50- moving average holds the market from falling further. If the price is not able to move higher again, traders should expect prices to fall further, which might cause the price to fall towards the USD 2.0000 level.
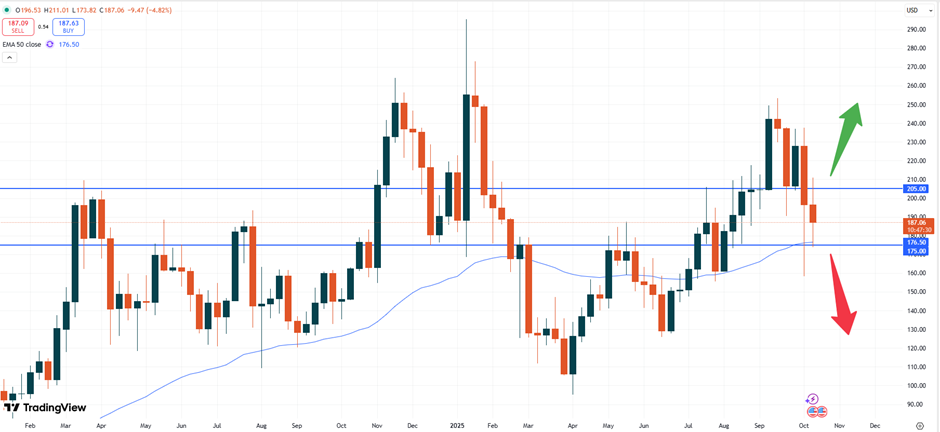
– SOL: Solana is trading at USD 187.04. The correction of Solana has been limited and the token might be set to break higher if prices will not fall further.
SOLUSD, weekly chart
The weekly chart shows that the token has tested the 50- moving average but currently keeps breaking away from that zone. If the price can stay above the USD 175.00 level upside momentum might follow. The positive trend might intensify above the USD 220.00 zone, while a break of the 50- moving average might indicate more trouble.
Vantage does not represent or warrant that the material provided here is accurate, current, or complete, and therefore should not be relied upon as such. The information provided here, whether from a third party or not, is not to be considered as a recommendation; or an offer to buy or sell; or the solicitation of an offer to buy or sell any financial instruments; or to participate in any specific trading strategy. Any research provided does not have regard to the specific investment objectives, financial situation and needs of any specific person who may receive it. We advise any readers of this content to seek their own advice. Without the approval of Vantage, reproduction or redistribution of this information is not permitted.