After the big move lower in October, most tokens started a recovery ending the month with a sideways pattern. Bitcoin and Ethereum offered a doji candlestick pattern, while the focus should be on the general risk sentiment in markets. Equities started to weaken slightly and the last week of trading was dominated by profit taking in markets.
The new Solana Staking ETF from Bitwise added USD 55 million during its first day of trading on Tuesday last week. The general positive momentum did not help markets much, though as the general risk sentiment seems to fade slightly. Yet, markets still show net- inflows and the ongoing earnings season could still help the risk sentiment to return towards the end of the year also helping the crypto market to move higher. The generally positive month of November might also continue to help markets moving higher this year.
Technical analysis:
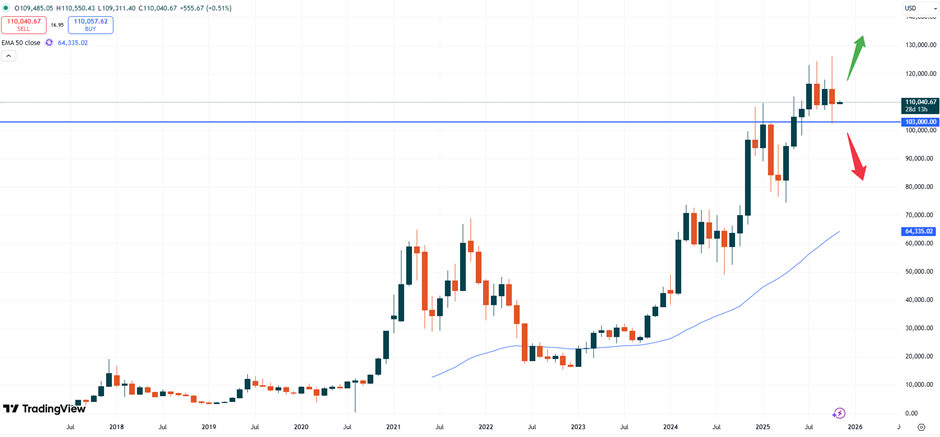
– BTC: Bitcoin is trading at USD 110,040. We try to examine the current trend based on the monthly chart. The uptrend remains intact but also got a dent with the doji- candlestick last month. Still, if the market will continue to trade above the USD 103,000 price level renewed upside momentum might be found.
BTCUSD, monthly chart
In general, a break of the USD 120,000 price level will confirm the bullish momentum, while slide price below the aforementioned support level might cause the market to weaken.
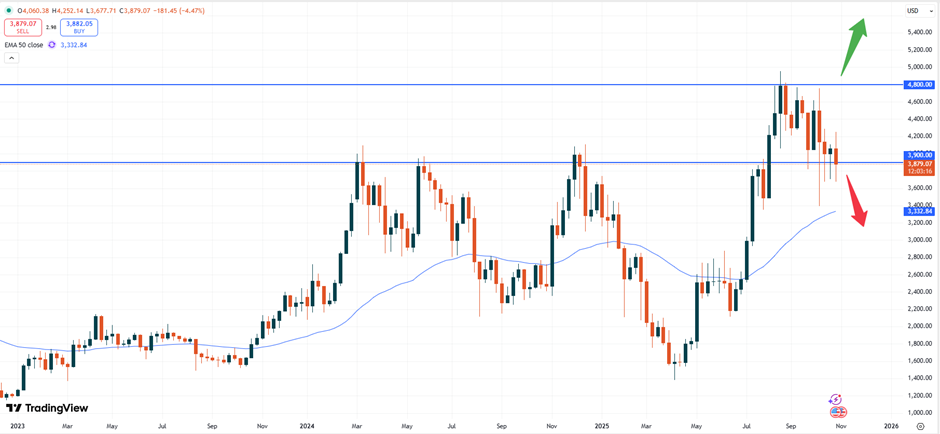
– ETH: Ethereum is currently trading at USD 3,879. The recent candlesticks based on the weekly chart showed long wigs to the downside. This could be seen as a positive pattern if the lows at USD 3,600 will not break to the downside.
ETHUSD, weekly chart
Yet, the USD 3,900 price zone and technical support level is also important. If the ETH can continue to trade above that level, immediate upside momentum might be found. Above the USD 4,000 price point immediate upside might then emerge. To the downside the market will also be supported by the 50- moving average price level. This zone currently sits at USD 3,332.
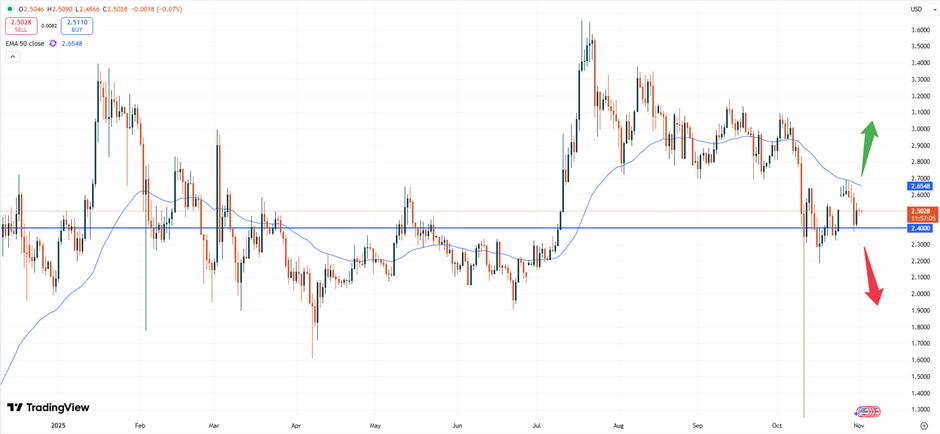
– XRP: XRP is currently trading at USD 2.5028. The prolonged sideways trend based on the chart below confirms that the market needs a breakout of that zone. The recent slide in the price can be seen as positive, which signals that buyers were able to step in moving the market quickly to the upside.
XRPUSD, daily chart
As the daily chart above shows, the price should not break the technical support level at USD 2.4000 now. If that range holds and the market can attempt a sustained break above the 50- moving average at USD 2.6548 more upside momentum might likely emerge pushing the market higher again.
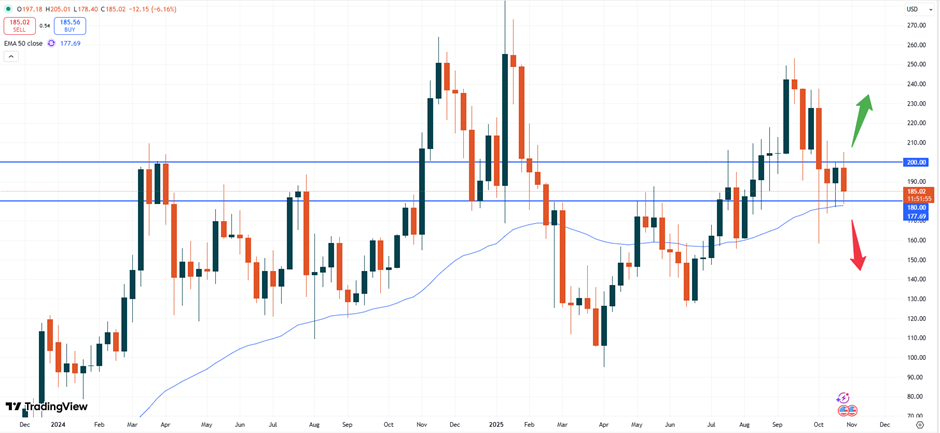
– SOL: Solana is currently trading at USD 185.02. This token remains in a small range between the USD 200.00 – USD 180.00 price level. A potential breakout might unleash a sharp move in prices into either direction.
SOLUSD, weekly chart
To the downside the market is well support by the psychological support level as well as the 50- moving average at USD 177.69. The upside seems to be capped with the fading risk sentiment in markets. In general, especially Solana seems to be vulnerable for potential losses.
Vantage does not represent or warrant that the material provided here is accurate, current, or complete, and therefore should not be relied upon as such. The information provided here, whether from a third party or not, is not to be considered as a recommendation; or an offer to buy or sell; or the solicitation of an offer to buy or sell any financial instruments; or to participate in any specific trading strategy. Any research provided does not have regard to the specific investment objectives, financial situation and needs of any specific person who may receive it. We advise any readers of this content to seek their own advice. Without the approval of Vantage, reproduction or redistribution of this information is not permitted.