It is expected that the Central Bank of the United States, the Fed, will cut rates during their meeting this week. This might help the Dollar to weaken and also help the risk sentiment in markets to stay positive. Indices like the Nasdaq among others might move to the upside and also help the crypto market to push higher. Furthermore, also the expansion of the fiscal policy from the White House might support the risk sentiment for markets in general. The positive momentum can already be seen during current trading.
On the flipside the increase in borrowing might lead to a rise in bond yields and inflation again. This would in the end cause rate cuts to be complicated and their impact might also fade as the rising bond supply would keep yields at elevated levels. This could act as potential headwinds in markets medium term.
Technical analysis:
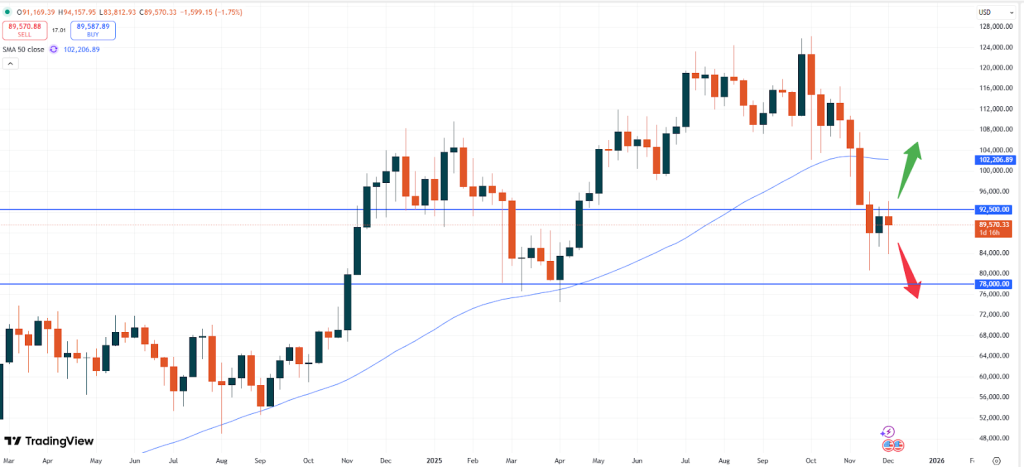
– BTC: Bitcoin is trading at USD 89,570. Despite the recent correction in prices during the first trading days of December, the market had started to push higher. Should the technical support level at USD 85,000 not break, more upside momentum might be seen. A weaker Dollar might also help an upward move.
BTCUSD, weekly chart
A break of the USD 90,000 zone might also help pushing the positive momentum towards higher levels, which could also act as guidance for other tokens. The USD 100,000 price level is not far. That zone would also go hand- in- hand with the 50- moving average resistance zone. A break of the above would clearly help Bitcoin to be back in the Santa- Claus rally.
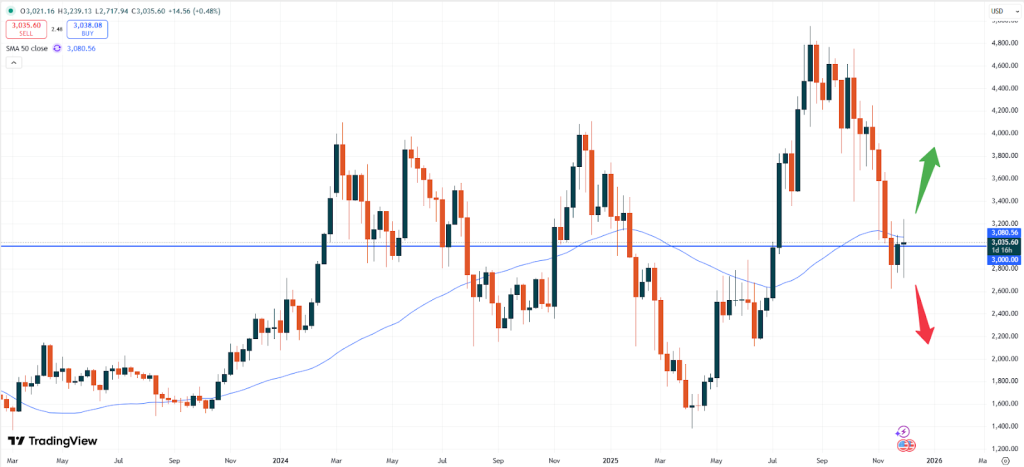
– ETH: Ethereum is currently trading at USD 3,035. After the sharp fall in recent week the market looks positive for now. With the price trading very close to the 50- moving average based on the weekly chart a rise in prices might happen soon. Similarly to Bitcoin, fresh upside momentum might be on the cards. Despite the big correction the general trend in this market has been in an elevated sideways trading range. This can also be found based on the monthly chart, where also the 50- moving average is acting as a strong support zone.
ETHUSD, weekly chart
Unless the psychological price level of USD 3,000 will break, traders should focus on upside momentum towards the USD 3,900 price level.
Vice versa the downtrend might gear up steam again, if the USD 2,500 level will be broken.
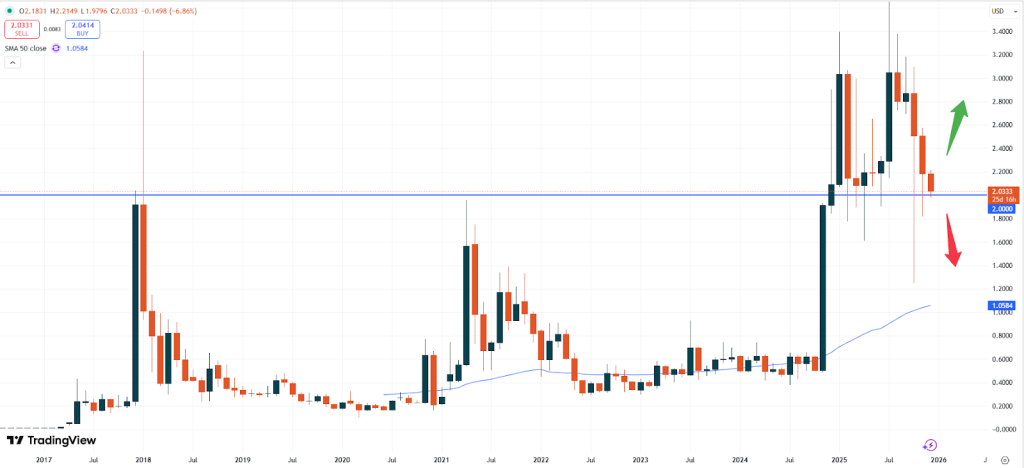
– XRP: Ripple is trading at USD 2.0330. Despite BTC and ETH moving to the upside, XRP seems to be reluctant to follow the slight positive trend as well. Instead, Ripple remains in the sideways pattern, with slight bearish momentum.
XRPUSD, monthly chart
Yet, if the USD 2.0000 price level will not break, more upside momentum might be seen. Due to the current weakness of the Dollar the market might also get a lift.
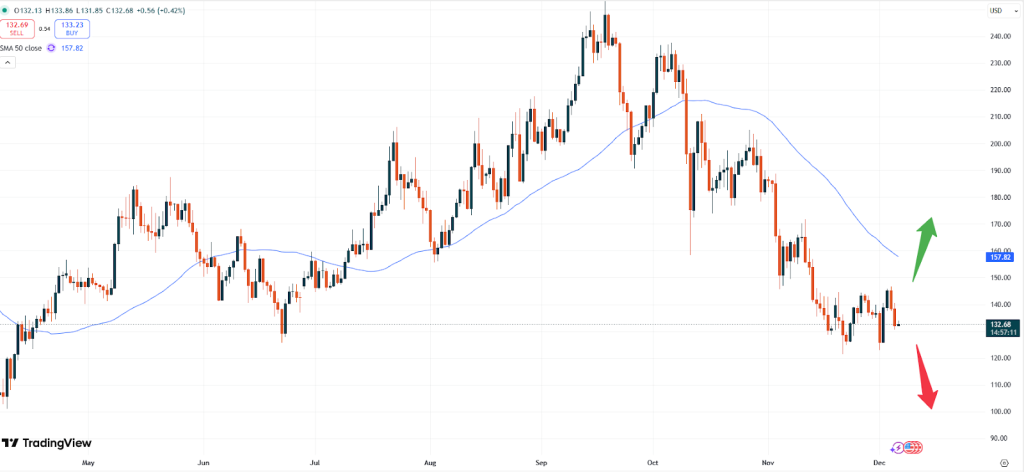
– SOL: Solana is trading at USD 132.68. As we pointed out several times before, the market seems to remain influenced by the bearish head- an- shoulders pattern based on the monthly chat. However, in the short- term upside momentum might also be found.
SOLUSD, daily chart
A push higher beyond the 50- moving average based on the daily chart above at USD 157.00 might indicate a rise in prices. Unless the technical support zone at USD 130.00 will break this trend might offer a relieve for now.
Vantage does not represent or warrant that the material provided here is accurate, current, or complete, and therefore should not be relied upon as such. The information provided here, whether from a third party or not, is not to be considered as a recommendation; or an offer to buy or sell; or the solicitation of an offer to buy or sell any financial instruments; or to participate in any specific trading strategy. Any research provided does not have regard to the specific investment objectives, financial situation and needs of any specific person who may receive it. We advise any readers of this content to seek their own advice. Without the approval of Vantage, reproduction or redistribution of this information is not permitted.