Markets remain bearish and keep pushing to the downside. After the big negative push towards lower levels in November, the fall of Bitcoin has also led most other tokens with a negative sentiment. In general, also the worries in regards to the highly leveraged AI sector caused the market sentiment to be negatively affected, causing prices to fall. Profit taking around the year- end might also affect markets, as it had been observed in the past as well.
Currently, the US technology index, the Nasdaq, keeps gearing up some steam. Potentially higher prices might also support the crypto market in the short- run, which might move markets to the upside for now.
Technical Analysis
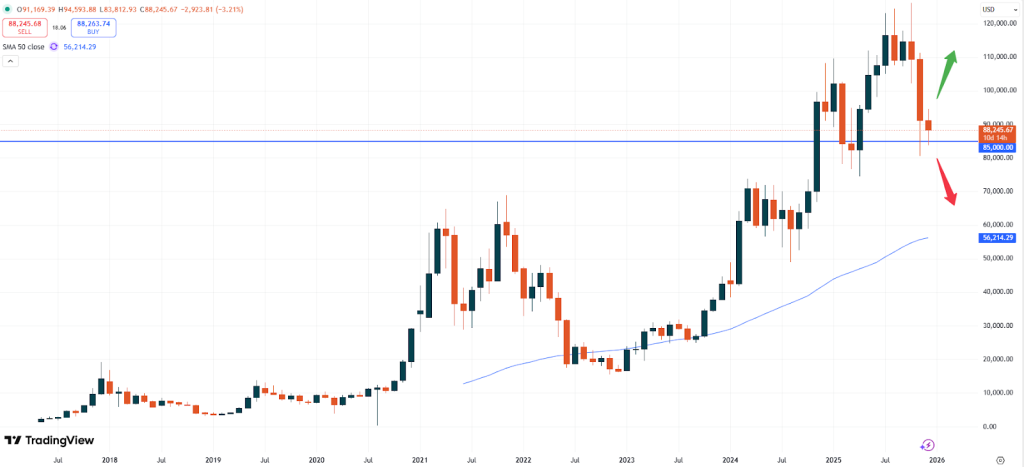
BTC – Bitcoin is trading at USD 88,245. The price of BTC remains prone for potential further profit taking and hence downside momentum. Yet, if the price of the token is able to remain above the USD 85,000 support zone, that might also push the market to higher levels, again.
BTCUSD monthly chart
On a positive note, traders might also pay attention towards the current candlestick pattern. The recent weakness in Bitcoin has fallen with only a minor slide in prices for now. If the market can stabilize around the current level and start to rise again, fresh upside momentum might emerge. Smaller candlesticks are a good indication for that.
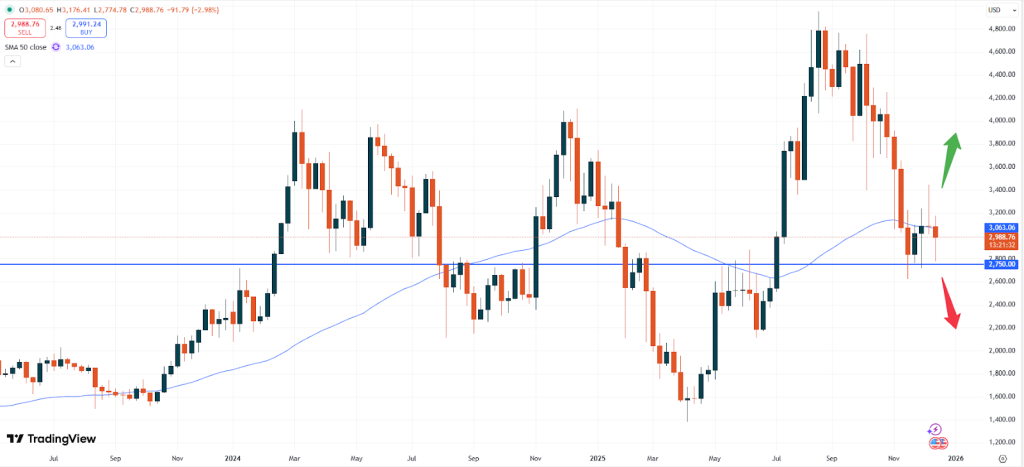
ETH – Ethereum is currently trading at USD 2,988. The market has traded in a sideways zone for the past five weeks without offering a clear direction. The pressure of more downside momentum has eased recently, as the market has stabilized. Yet, also fresh upside momentum seems to reman limited with the technical pinbar candlestick pattern, inhibiting the price from rising beyond the USD 3,450 price level.
ETHUSD weekly chart
Since the market continues to trade below the 50- moving average based on the weekly chart, more downside momentum might still remain on the cards. The negative trend might gear up steam if the market falls below the USD 2,750 zone. On the other hand, also upside momentum might build up momentum if the price does not break the USD 2,750 support level. Another attempt of rising prices towards USD 3,600 could then emerge.
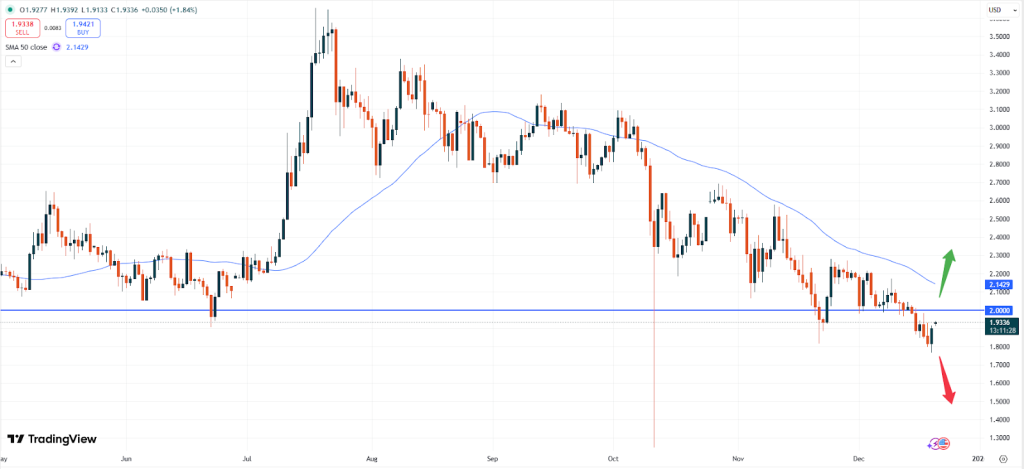
XRP – Ripple is currently trading at USD 1.9336. With the break of the psychological support level of USD 2.0000 the slide in prices seems to continue. Currently, though, the market seems to stabilize as last week’s green candlesticks indicate that fresh upside momentum could gear up steam.
XRPUSD daily chart
The positive momentum began at the same time, when also the Nasdaq index started to rise again. The positive move might hence help the market to move higher. At the 50- moving average level at 2.1429 the trend will show if the positive momentum might continue.
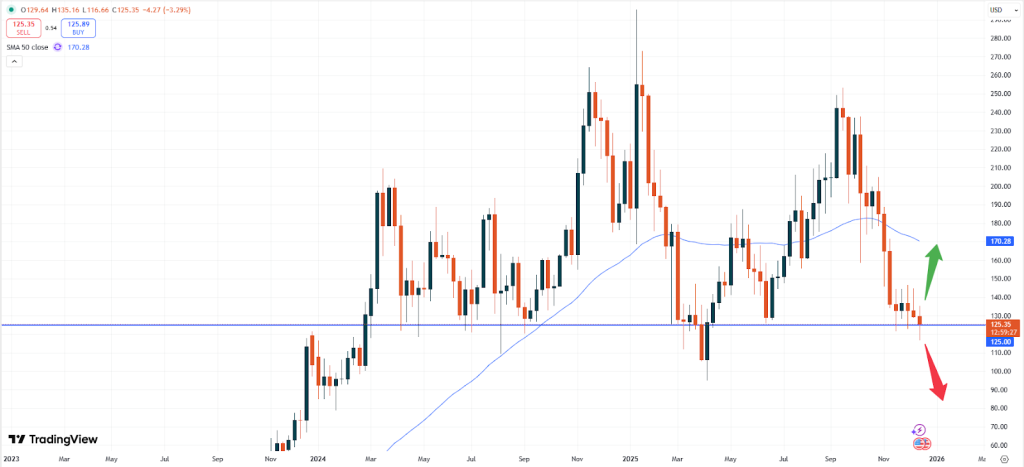
SOL – Solana is currently trading at USD 125.43. Also, Solana is trading on top of a psychological support level currently with the risk that this zone will break to the downside.
SOLUSD weekly chart
If the market is not able to remain on top of this zone, a further slide in prices should be expected. Yet, the psychological USD 125.00 level remains strong as it currently helps the market to push higher again if the general trend in the crypto space will turn positive again.
Vantage does not represent or warrant that the material provided here is accurate, current, or complete, and therefore should not be relied upon as such. The information provided here, whether from a third party or not, is not to be considered as a recommendation; or an offer to buy or sell; or the solicitation of an offer to buy or sell any financial instruments; or to participate in any specific trading strategy. Any research provided does not have regard to the specific investment objectives, financial situation and needs of any specific person who may receive it. We advise any readers of this content to seek their own advice. Without the approval of Vantage, reproduction or redistribution of this information is not permitted.