With the slight correction in the equity market also the crypto space is looking negative. Bitcoin has not only broken below the USD 90,000 level but is currently also trading below USD 80,000. The altcoin sector does not look any better and might even correct further towards lower levels. With the general rise in volatility in most markets the downside momentum might even increase.
Gold prices have been correcting; Silver is losing sharply while oil prices continue to remain elevated. This week might hence offer further insights into most markets and whether the negative pressure might continue.
Technical analysis:
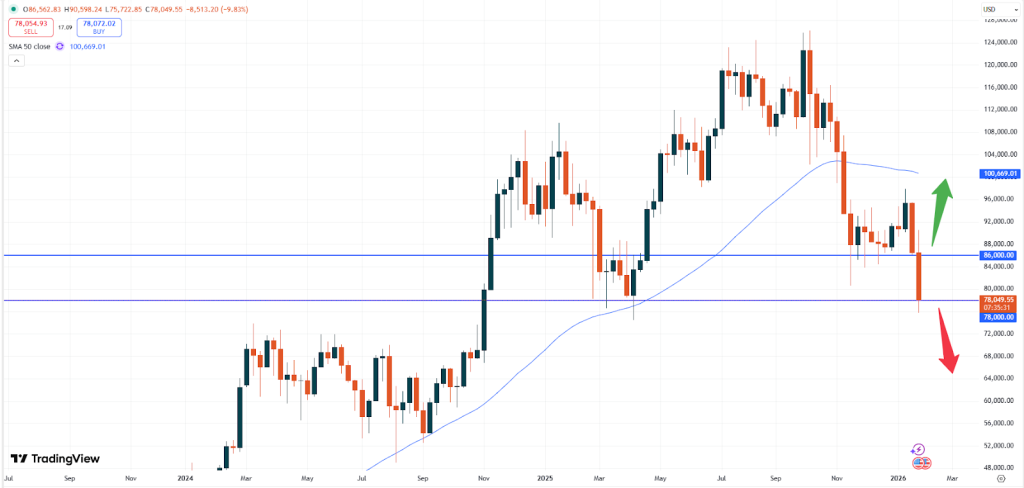
– BTC: Bitcoin is trading at USD 78,053. Due to the break of the psychological US 90,000 level more downside momentum might now follow. The chart of Bitcoin currently indicates that the market seems to be keen to turn around and hence favor lower prices.
BTCUSD, weekly chart
The weekly chart above shows, that the recent support level had failed to support the market. Now, the market is testing the USD 78,000 price level. Currently it looks like the price might even slide below that zone. Yet, any positive signs from the equity market might still cause a rise towards higher levels. A clear break of the current level will indicate a retest of the USD 70,000 price zone.
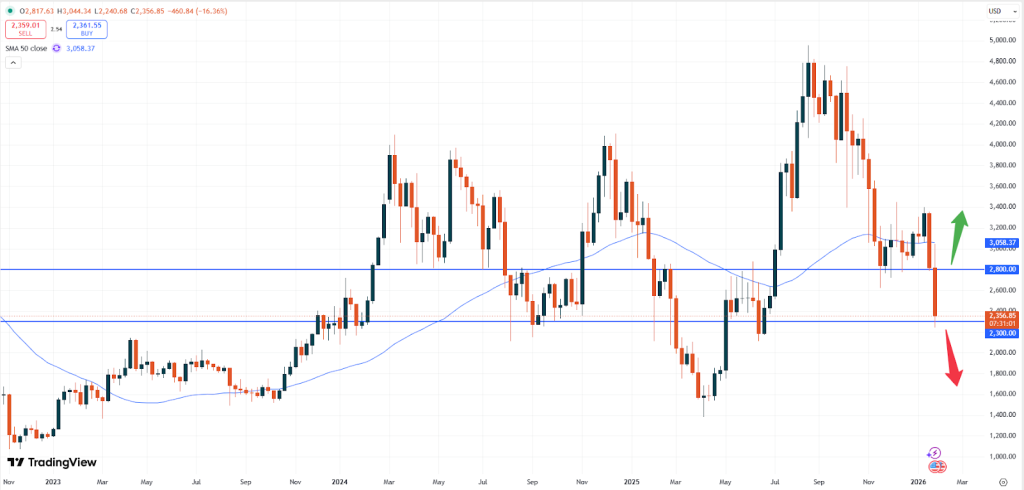
– ETH: Ethereum is currently trading at USD 2,357. Also, this token is losing steam and might still push to lower levels for now. If the market does not stop to fall, the break of the current support of USD 2,300 might be on the cards.
ETHUSD, weekly chart
The weekly chart above shows, that the negative sentiment is seemingly getting the upper hand currently. While a break of the current support level seems likely the game might change if the market will be able to break higher. This might need a break above the USD 2,800 level.
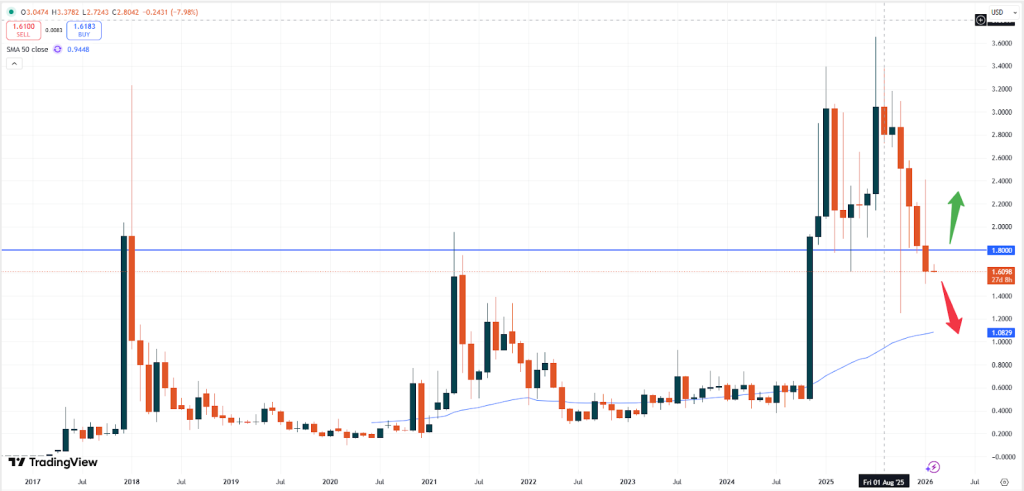
– XRP: XRP is currently trading at USD 1.6098. As we stated before Ripple was in a major downtrend, according the bearish candlestick pattern from December. The downside facing candle with the long wick to the upside shows that trouble might be ahead.
XRPUSD, monthly chart
The current bearish continuation pattern indicates that the market might proceed even lower. The price is trading well below the psychological level of USD 2.000 and could push back down towards the 50- moving average level at around 1.0827. Yet, the current area, which was a technical resistance in April 2021 might also help the market and push prices higher again.
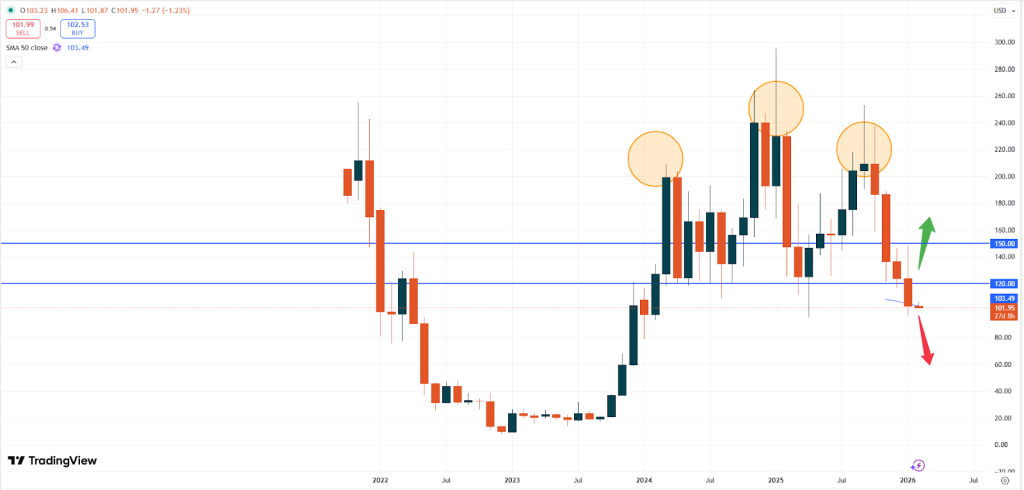
– SOL: Solana is currently trading at USD 101.80. Based on the long-term monthly chart the market keeps following the bearish pattern. Based on the head- and- shoulders formation traders should focus on more downside momentum.
SOLUSD, monthly chart
With the break of the USD 120.00 price level the slide seems to be due to continue. The upcoming USD 90.00 level might only offer some support and the price could be on track to retest the USD 25.00 level from 2023 if no bullish momentum will re-emerge.
Vantage does not represent or warrant that the material provided here is accurate, current, or complete, and therefore should not be relied upon as such. The information provided here, whether from a third party or not, is not to be considered as a recommendation; or an offer to buy or sell; or the solicitation of an offer to buy or sell any financial instruments; or to participate in any specific trading strategy. Any research provided does not have regard to the specific investment objectives, financial situation and needs of any specific person who may receive it. We advise any readers of this content to seek their own advice. Without the approval of Vantage, reproduction or redistribution of this information is not permitted.