The crypto market in general remains in a negative pattern and no signs currently emerge, that it might start moving higher for now. With Bitcoin currently forming a triangle pattern, potentially leading to a breakout, market participants also focus on social media data. The words “Bitcoin to zero” have been searched for countless times in the US recently according to Google data and even hit an all- time- high. Yet, such moves have also peaked in the past. In particular between 2021 and 2022 the market then led to a bottom being able to rise from there. Currently, geopolitical tensions are flaring up as well. The tensions in regards to Iran and the news around US tariffs have added an array of negative headlines market still need to digest.
Technical Analysis
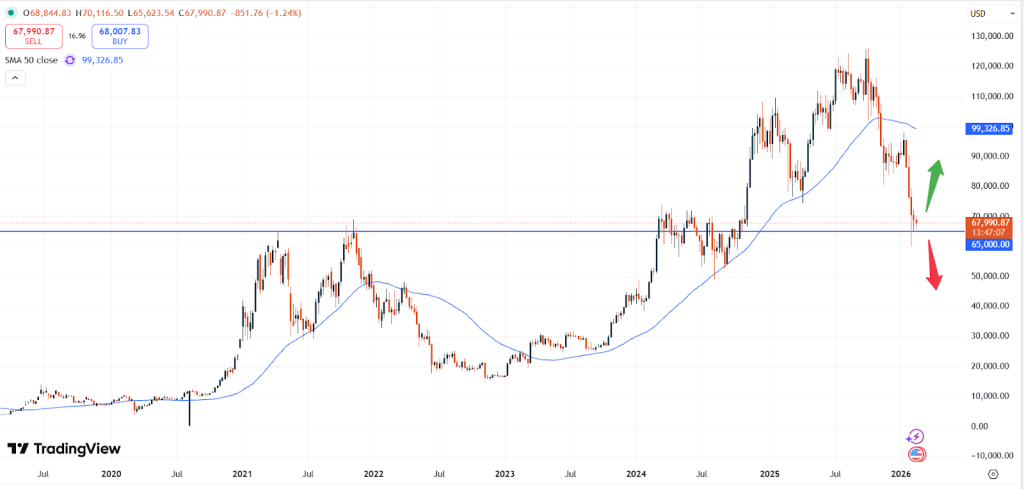
BTC – Bitcoin is trading at USD 67,991 and the price of this market is still inching lower for now. Yet, the slight rebound from previous levels just above the USD 60,000 price tag might also help the positive trend to continue.
BTCUSD weekly chart
The weekly chart of Bitcoin above shows that the current pattern suggests that a strong support level could support a bullish view as well. The same are had been a technical resistance zone in November 2021. This might now help the price to move higher, if a catalyst for this argument can be found. The fundamental data above might be taken into consideration her as well. Yet, if this area will give way a sharper slide in prices might occur as well. Below the USD 80,000 price level setbacks might still occur causing the bearish momentum to return.
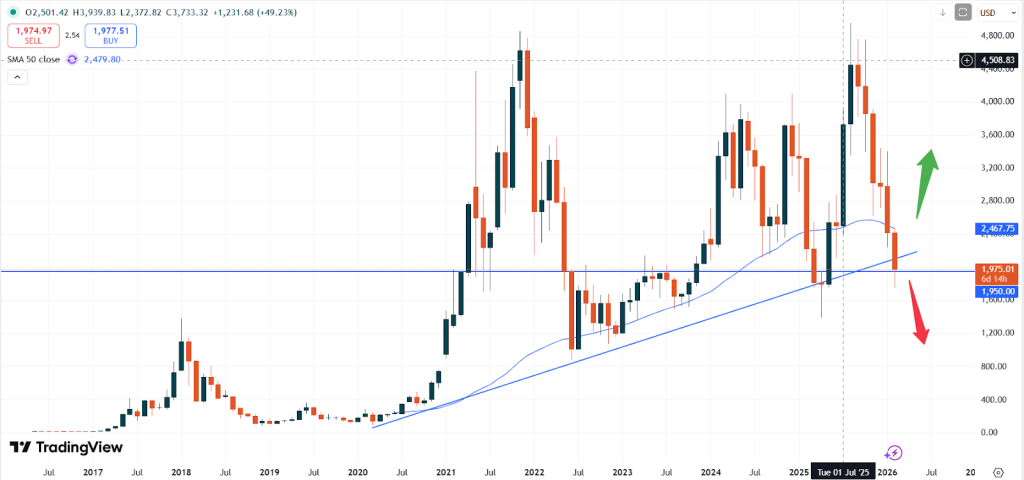
ETH – Ethereum is currently trading at USD 1,975. Based on long-term patterns the market also looks like it will push lower from current levels. Since ETH continues to trade below the 50- moving average, which keeps being a technical resistance zone more downside momentum might occur.
ETHUSD monthly chart
However, positive signs might also be taken into account here. If the price is able to push higher and start to trade above the rising trendline as seen above a push beyond the 50- moving average level might also be on the cards. This last trading week for the month of February will be important to get fresh insights and a potentially new trend.
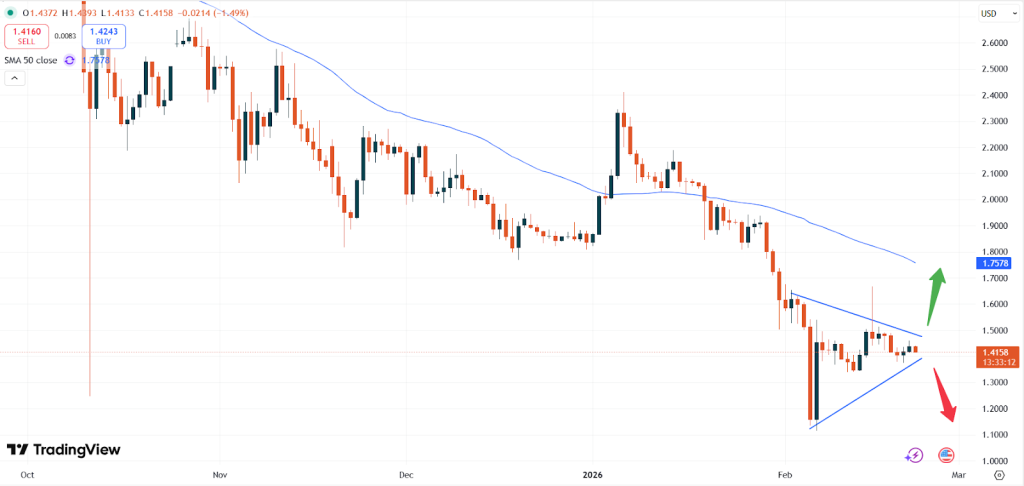
XRP – Ripple is currently trading at USD 1.4158. Similarly to the other coins also XRP is trading in a triangle pattern, which can be observed well based on the daily chart. A breakout seems to be on the cards anytime soon.
XRPUSD daily chart
As the chart above shows a price above the 1.5000 price level might indicate that prices could rise again, while a break below 1.4000 might show the exact opposite. The upside then seems capped by the 50- moving average level and the downside might be all the way towards parity.
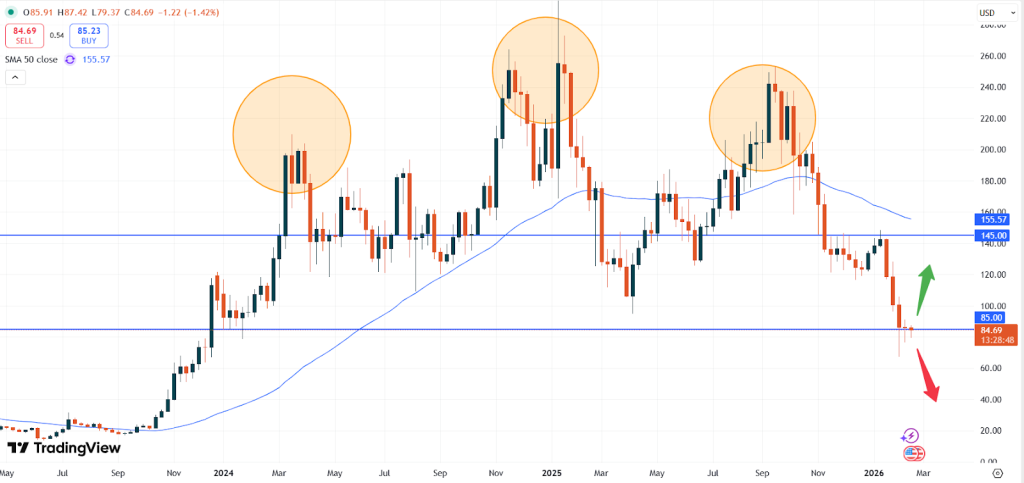
SOL – Solana is currently trading at USD 84.70. The market remains in its sideways pattern but has found some support as prices stopped falling as well. If the current support level lasts fresh upside momentum might be on the cards.
SOLUSD weekly chart
The upside remains limited with the technical zone around the 50- moving average level and the overall picture for Solana still suggests that falling prices seem rather likely.
Vantage does not represent or warrant that the material provided here is accurate, current, or complete, and therefore should not be relied upon as such. The information provided here, whether from a third party or not, is not to be considered as a recommendation; or an offer to buy or sell; or the solicitation of an offer to buy or sell any financial instruments; or to participate in any specific trading strategy. Any research provided does not have regard to the specific investment objectives, financial situation and needs of any specific person who may receive it. We advise any readers of this content to seek their own advice. Without the approval of Vantage, reproduction or redistribution of this information is not permitted.