Last week, the crypto market initially started moving higher but ended trading on a bearish note. With the break of previous lows, the downside pressure might now continue also supported by the rise in geopolitical tensions. With the attacks on Iran, it becomes clear once more that Bitcoin has been falling short of acting as a safe- haven asset and instead negative follows investors risk appetite.
The downside might be explained with the rise in US producer prices, which grew by 0.8% on a monthly basis as data showed on Friday last week. Furthermore, positive earnings from Nvidia earlier on did not support the stock price moving higher but instead caused the market to fall. The negative sentiment around the tech sector hence causes the crypto market to remain under pressure. While BTC fell, altcoins like SOL and ETH dropped more than 6%.
Technical analysis:
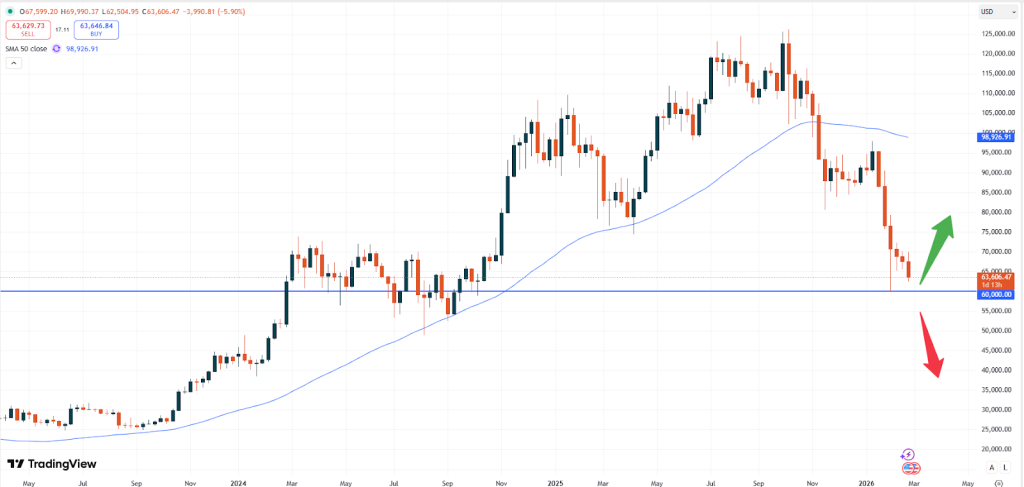
– BTC: Bitcoin is trading at USD 63,620. The market continues to remain in a steady decline. Fundamentally we can also highlight that recent three-year bull runs and the following one- year bearish decline might still exist today. This would only support prices to substantially rise potentially in October this year. Upside momentum might still emerge in between whereas current levels don’t offer much motivation for now.
BTCUSD, weekly chart
After a potential test of the psychological support level of USD 60,000 the price of Bitcoin might start to rise. Bullish candlestick patterns should consecutively form for some days to support a bullish view, while a clear break of the USD 60,000 zone would cause the market to fall further.
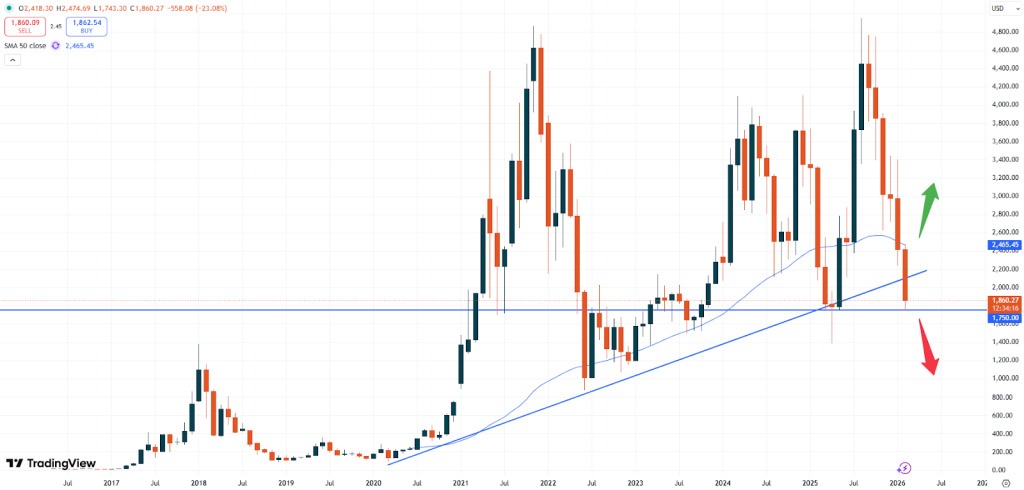
– ETH: Ethereum is currently trading at USD 1,860. The price of this token continues to fall further as well. With the break of the rising trendline at about the USD 2,000 price level, more negative pressure might occur.
ETHUSD, monthly chart
The market created a high in August 2025, which was only slightly above the previous high from November 2021. In order to resume substantial upside momentum Ethereum needs to first break above the 50- moving average level at about USD 2,445. Until this is the case the market might continue to slide lower and retest the USD 1,500 level.
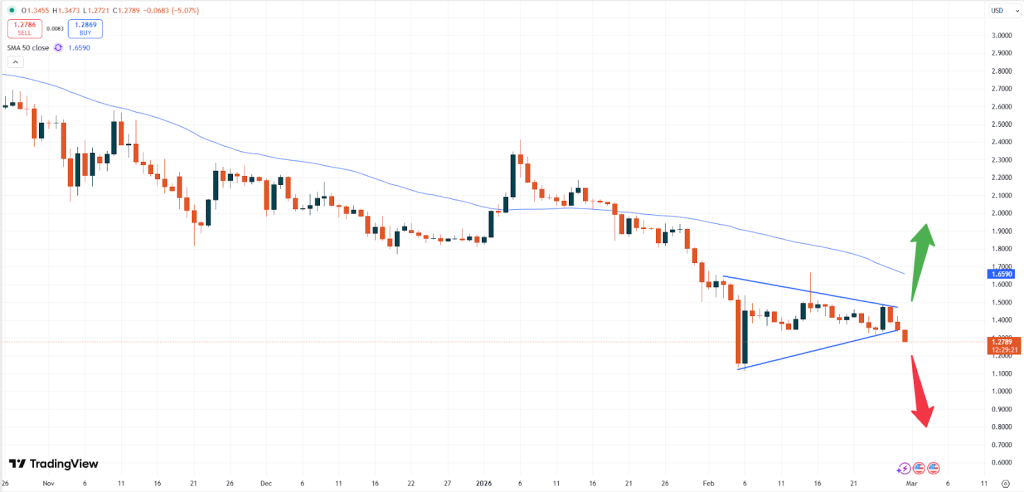
– XRP: XRP is currently trading at USD 1.2786. The price of XRP keeps fading and with that the odds of a rise in this market seem far as well. Due to the negative momentum in BTC altcoins tend to even fade more.
XRPUSD, daily chart
The breakout to the downside based on the daily chart shows that the negative pressure is currently increasing. Without a major support zone in sight the market momentum is expected to remain negative. Only a break above the level of USD 1.5000 might support positive momentum.
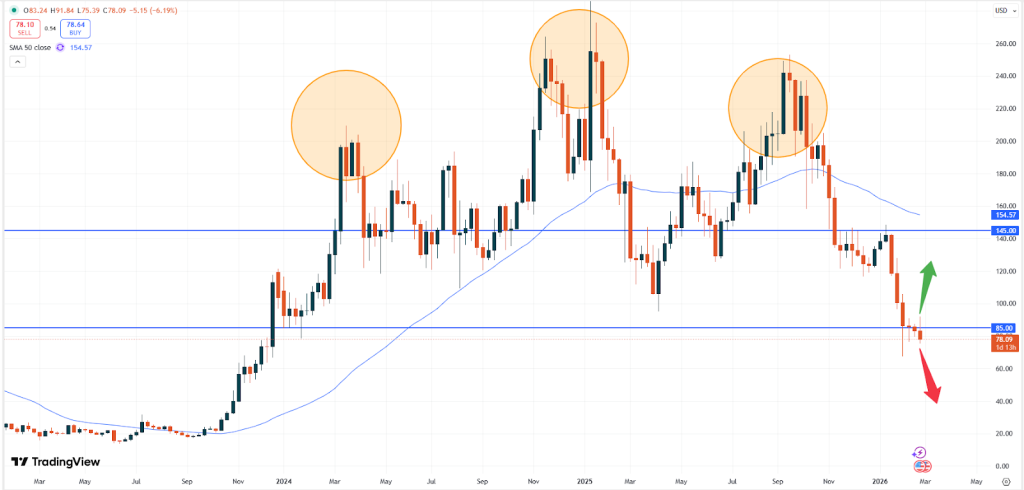
– SOL: Solana is currently trading at USD 78.09. Due to the long-term bearish- looking trend the market is expected to weaken further.
SOLUSD, weekly chart
Based on the weekly chart above the market is currently being supported by the USD 75.00 technical zone. Yet a fade of that level might be on the cards soon, which could cause the pair to break down towards the USD 25.00 level eventually. While retracements to the upside might be used to sell into rallies the general trend remains extremely weak.
Vantage does not represent or warrant that the material provided here is accurate, current, or complete, and therefore should not be relied upon as such. The information provided here, whether from a third party or not, is not to be considered as a recommendation; or an offer to buy or sell; or the solicitation of an offer to buy or sell any financial instruments; or to participate in any specific trading strategy. Any research provided does not have regard to the specific investment objectives, financial situation and needs of any specific person who may receive it. We advise any readers of this content to seek their own advice. Without the approval of Vantage, reproduction or redistribution of this information is not permitted.