The risk sentiment in markets remains generally negative. With the correction especially of the Nasdaq technology index, the downside pressure of the crypto market might increase further as well. Last week initially started on a positive note but the sentiment faded on Wednesday, when negative sentiment took over the market. The short rally might be over as the war in the Middle East continues to harm market sentiment. The trend is not new but has happened a lot recently. Selling pressure in the crypto market usually increased during trading over the weekend.
In general, the trend might also depend on the momentum of the Dollar. The Greenback has posted its strongest gain in a year and if that strength continues it might push the crypto market lower as well.
Technical analysis:
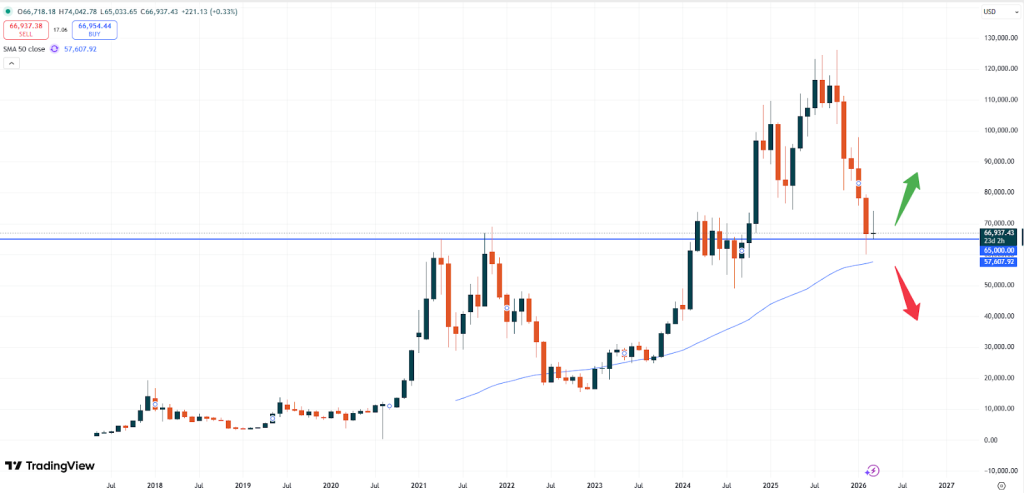
– BTC: Bitcoin is trading at USD 67,909. The market has been falling towards the end of last week and with that eradicating most gains for this week. Being still early in the month of March we still might have already seen the highs if the negative sentiment continues to push prices lower.
BTCUSD, monthly chart
It is now crucial to take the technical support level of USD 65,000 into consideration. A fall below that level might increase the selling pressure. The price could then test the 50- moving average zone at around USD 57,600.
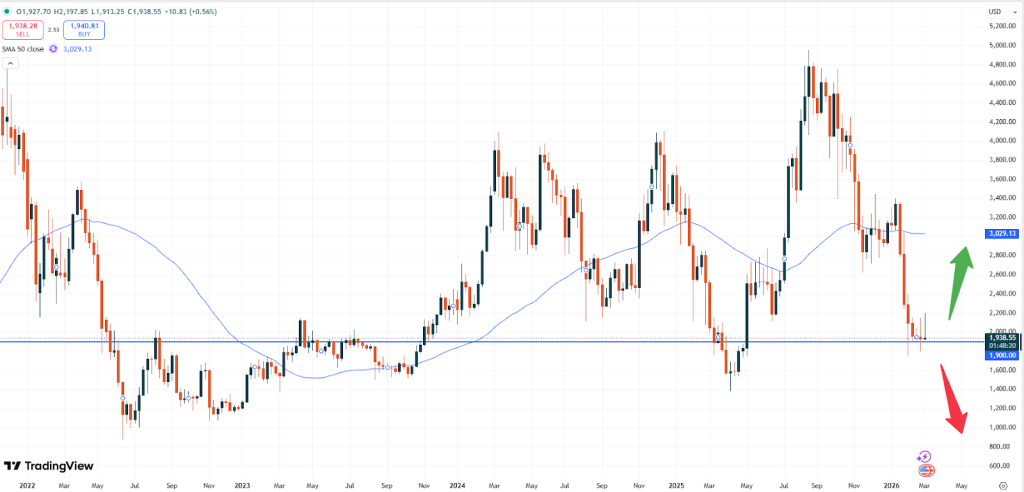
– ETH: Ethereum is currently trading at USD 1,946. The biggest altcoin by market capitalization keeps also falling to lower levels. With only slight positive momentum in sight, the pressure might intensify below the zone of USD 1,900.
ETHUSD, weekly chart
As the market keeps trading above the 50- moving average for now the positive sentiment might still return pushing this market higher again. The sentiment is only expected to fade if the market will trade below the psychological USD 3,000 level. Sliding prices towards the area of USD 2,300 might then be on the cards.
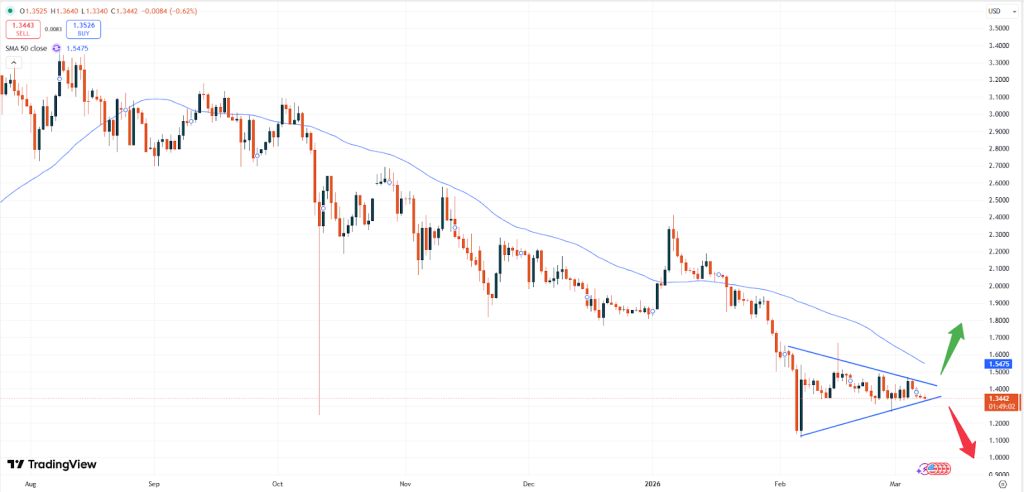
– XRP: Ripple is trading at USD 1.3482 and continues to fall back to lower levels. With Bitcoin not showing any signs of a potential move higher also altcoins keep pushing to the downside. Fundamentally this token oftentimes did not need any news in order to push higher but was also driven by buying momentum.
XRPUSD, daily chart
That said, the daily chart above shows, that the market has already fallen below the triangle formation. Furthermore, it seems that with the sideways pattern right on top of that current horizontal level and push higher might end at the falling triangle zone. The downtrend is currently just too strong to look for buying opportunities.
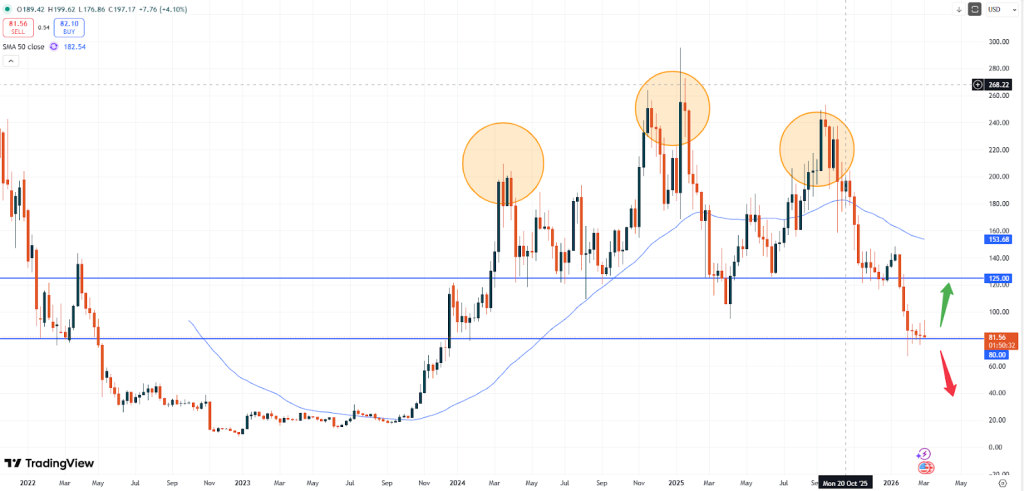
– SOL: Solana is trading at USD 82.20 and keeps sliding lower week after week. The USD 80.00 level might add some buying momentum, if the general sentiment in the crypto market will turn positive.
SOLUSD, weekly chart
From a technical perspective the market is at crossroads now. A retracement higher could lift Solana towards the USD 100.00 – 125.00 level. Yet, the selling pressure seems stronger and hence traders should expected the downside momentum to increase pace below the beforementioned support zone.
Vantage does not represent or warrant that the material provided here is accurate, current, or complete, and therefore should not be relied upon as such. The information provided here, whether from a third party or not, is not to be considered as a recommendation; or an offer to buy or sell; or the solicitation of an offer to buy or sell any financial instruments; or to participate in any specific trading strategy. Any research provided does not have regard to the specific investment objectives, financial situation and needs of any specific person who may receive it. We advise any readers of this content to seek their own advice. Without the approval of Vantage, reproduction or redistribution of this information is not permitted.