Most stock markets have been able to gear up some momentum during the last trading week. Also, the Nasdaq technology index has been rising more than 4%. Yet, the crypto market, which has been following US stocks as well, was not able to move higher.
The demand of Bitcoin for example remains strong with institutional buyers including ETFs accumulating BTC near record levels. On the other hand, whales, miners and other holders are pushing prices lower as they overwhelm the market offloading their holdings. On-chain data also shows this behavior: the demand seems to thin out further as large holders aggressively distribute while US institutional demand remains lower. The biggest buyers with wallets holding between 1,000 – 10,000 BTC have now shifted to the biggest sellers, which seems to increase the pressure in markets.
Technical analysis:
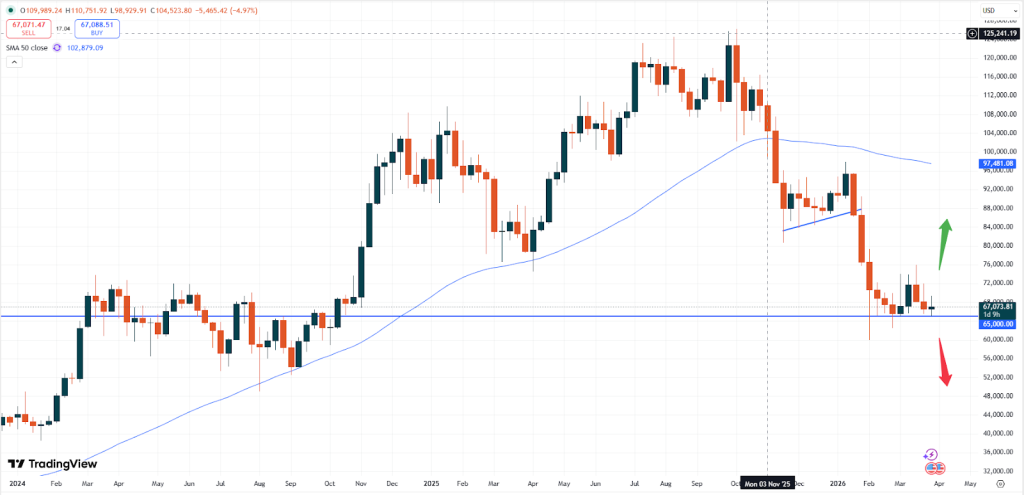
– BTC: Bitcoin is trading at USD 67,073. After the recent attempt to move higher, the negative sentiment seems to be back in control. Also, the rise in the equity market did not help Bitcoin much. Instead, the sentiment seems to be driven by profit taking as outlined above.
BTCUSD, weekly chart
If the price of Bitcoin will break the major support zone at USD 65,000 the market might slide further. The longer the price remains in a sideways pattern, the more the odds will increase for a slide to the downside. Then, BTC might retest the next support level in the range of USD 55,000.
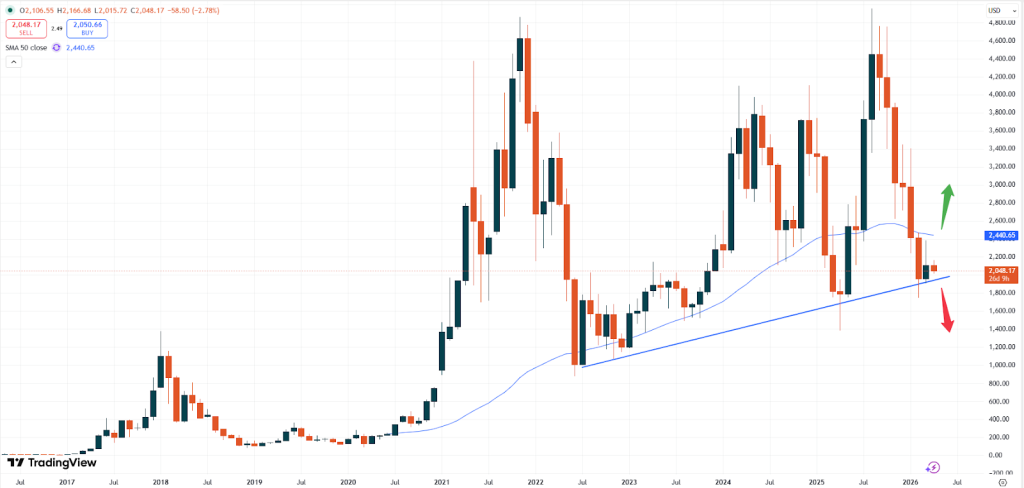
– ETH: Ethereum is currently trading at USD 2,048. Similar to Bitcoin also Ether remains capped below the 50- moving average zone and hence might be prone to profit taking. A slide below the psychological USD 2,000 level might then extend the losses and potentially could push the token much lower.
ETHUSD, monthly chart
Based on the monthly chart above the market might soon fall further if the recent low will break. Last month, the price went initially to the upside but was then capped at USD 2,365. With the price losing momentum in the end the slide might now continue. The overall chart currently shows, that below the price of USD 1,946 the downside might increase. This is exactly below the level of the last two months. On the flipside a break of the 50- moving average is needed to push the market higher.
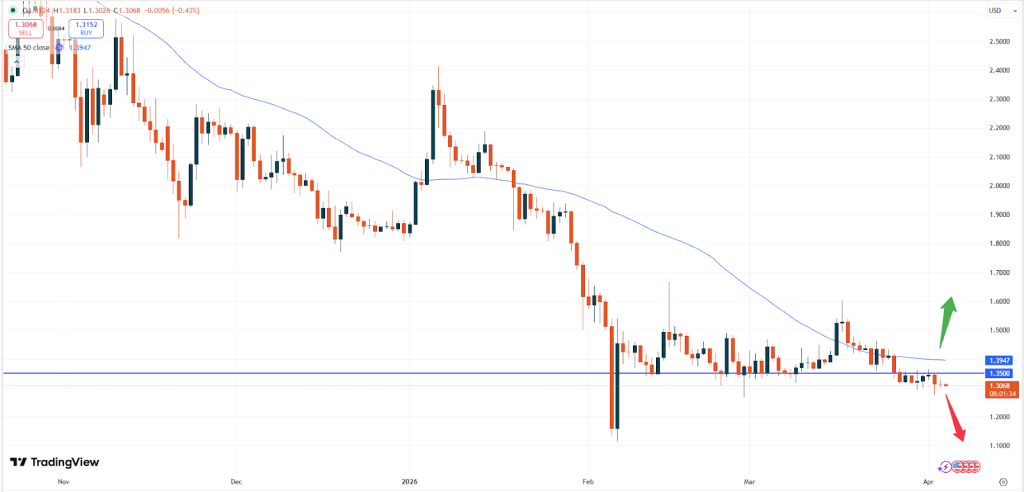
– XRP: XRP is currently trading at USD 1.3068. Like most cryptos also the price of Ripple has been falling. The chart below shows, that the market has been capped and rising prices have always been sold off for the past seven months.
XRPUSD, daily chart
Based on the daily chart above, the 50- moving average zone mostly acted as a technical resistance level. Breaks above that zone have led to renewed selling pressure in the end. With the current break of the support zone of 1.3500 the price might even continue to weaken further. A break below 1.3000 could quickly cause the market to move lower.
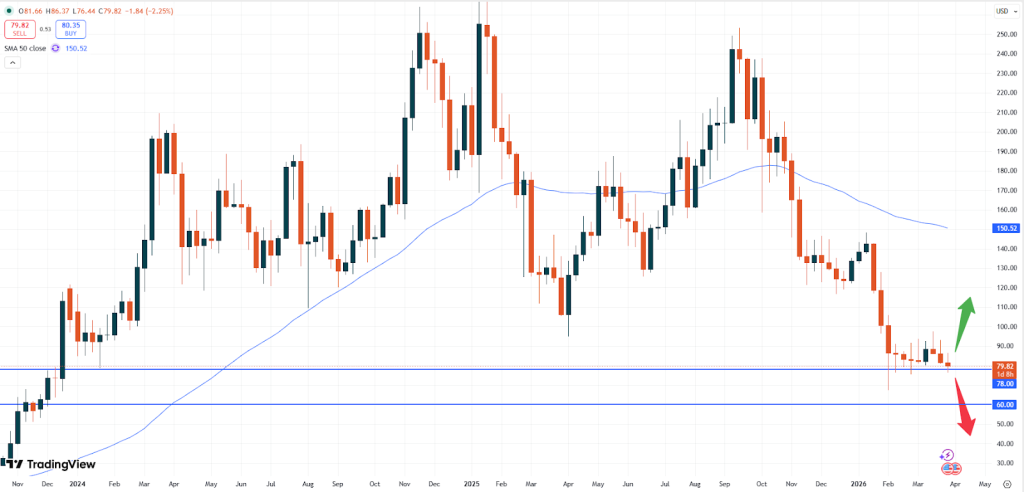
– SOL: Solana is currently trading at USD 79.82. The price of this token keeps pushing lower and hence follows all other cryptocurrencies we examined above. The market remains capped below the USD 100.00 level without an intend to push higher.
SOLUSD, weekly chart
The weekly chart above shows, that a break of the USD 78.00 zone might unleash another push to the downside. The next target might be the USD 60.00 zone, which had been a support level back in November 2023.
Vantage does not represent or warrant that the material provided here is accurate, current, or complete, and therefore should not be relied upon as such. The information provided here, whether from a third party or not, is not to be considered as a recommendation; or an offer to buy or sell; or the solicitation of an offer to buy or sell any financial instruments; or to participate in any specific trading strategy. Any research provided does not have regard to the specific investment objectives, financial situation and needs of any specific person who may receive it. We advise any readers of this content to seek their own advice. Without the approval of Vantage, reproduction or redistribution of this information is not permitted.