With the 180-degree change of the equity market on Thursday last week, the positive sentiment might now continue. While the S&P 500 has been rising also the Nasdaq index created a new all- time high and even marched higher. The NAS100 can be used as guidance also for the crypto market.
On the other hand, the quieter summer months have also proven that the upside in risky assets might remain limited. The old saying “sell in May and go away” can be validated. The warmer season in summer, where the focus is being diverted away from the charts has led to less growth also in the crypto market in general. The upside had usually resumed pace again in September.
Technical analysis:
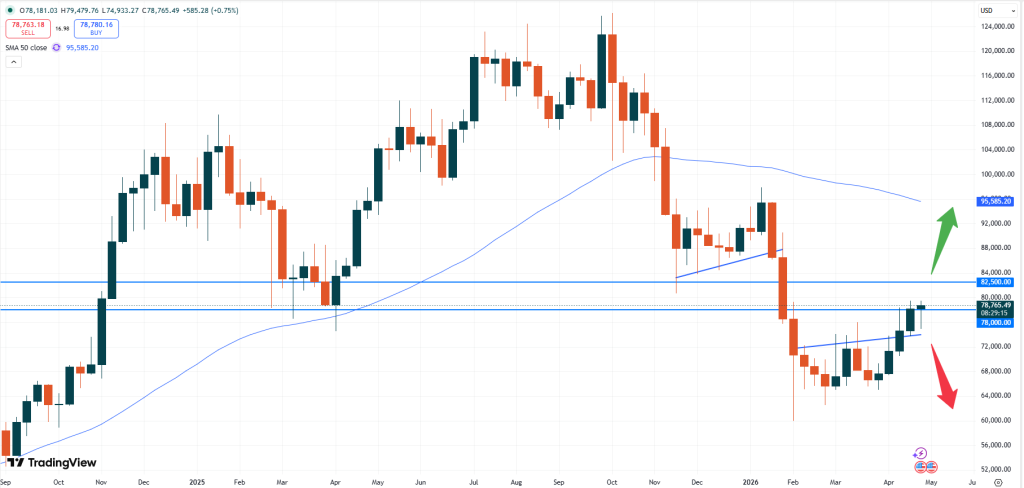
– BTC: Bitcoin is trading at USD 78,765. Last week, the token initially looked like it will fall but ended trading extremely positive. The recent resistance zone of USD 78,000 has been broken again. This might now continue to support the risk sentiment and might push Bitcoin higher again.
BTCUSD, weekly chart
The next technical resistance level might be found at USD 82,500. That level was an important technical support level in March 2025 and might hence act as a resistance area right now. While some slightly lower prices might occur early this week, such retracements can be used as entry opportunities. Caution should only be observed if the price falls back below the lows from last week.
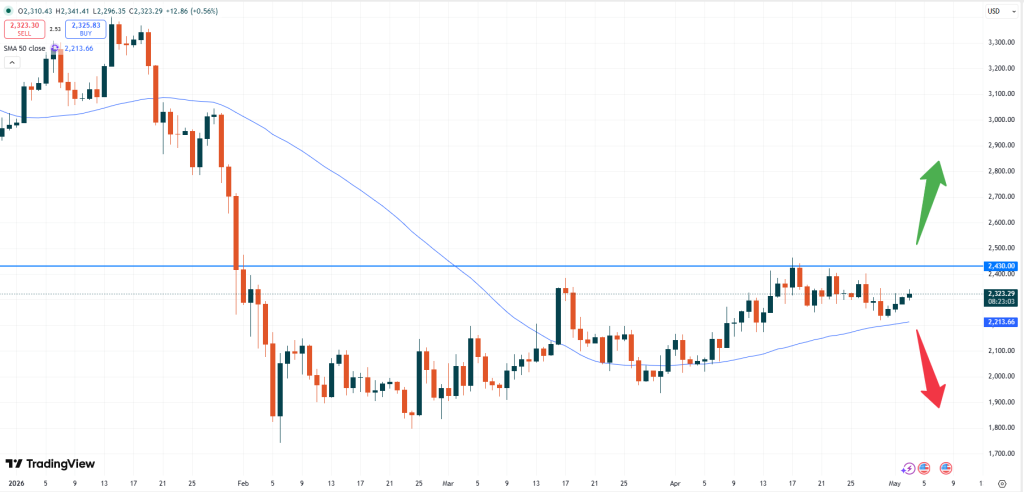
– ETH: Ethereum is currently trading at USD 2,323. The price of this token is also moving higher but its intensity is lagging behind the positive momentum of Bitcoin. A break of the USD 2,400 technical resistance zone is needed in order to unleash more upside.
ETHUSD, daily chart
The positive sentiment of Ethereum might be supported by the fact that the price keeps trading above the 50- moving average level based on the daily chart above. Only a break below might signal that the positive trend will end. Traders should hence also pay attention to the overall risk sentiment in markets.
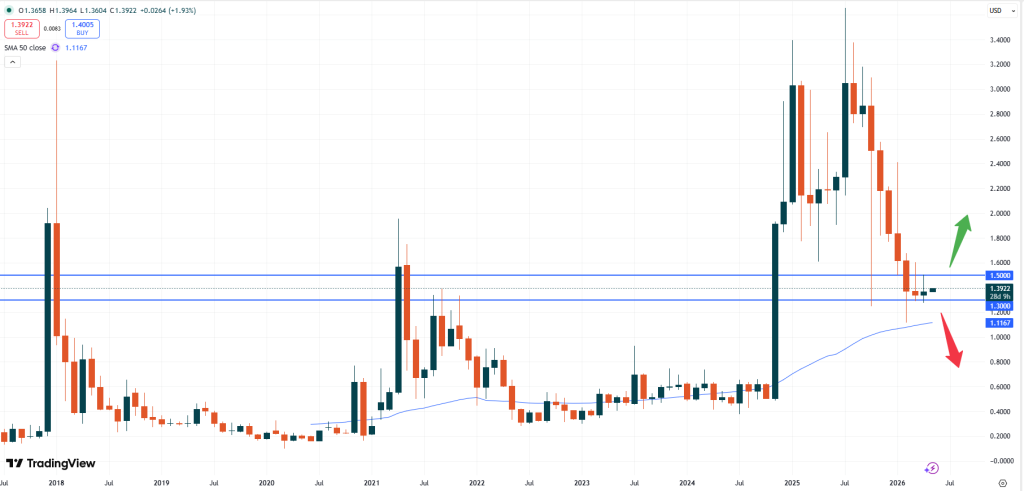
– XRP: XRP is currently trading at USD 1.3922. The trend of Ripple remains constructive but the absence of the “altcoin seasons” means that most momentum will be directed to Bitcoin.
XRPUSD, monthly chart
Based of the monthly chart above XRP has not been able to trade beyond USD 1.6000. That level marks the high- point of the month before. A break above might indicate a potential end of the bearish trend. Yet, prices have stopped to fall and stabilized as well above the 50- moving average level, which is positive. The next strong resistance level might now be at USD 1.5000. If XRP can break this price, more intensity to the upside might occur.
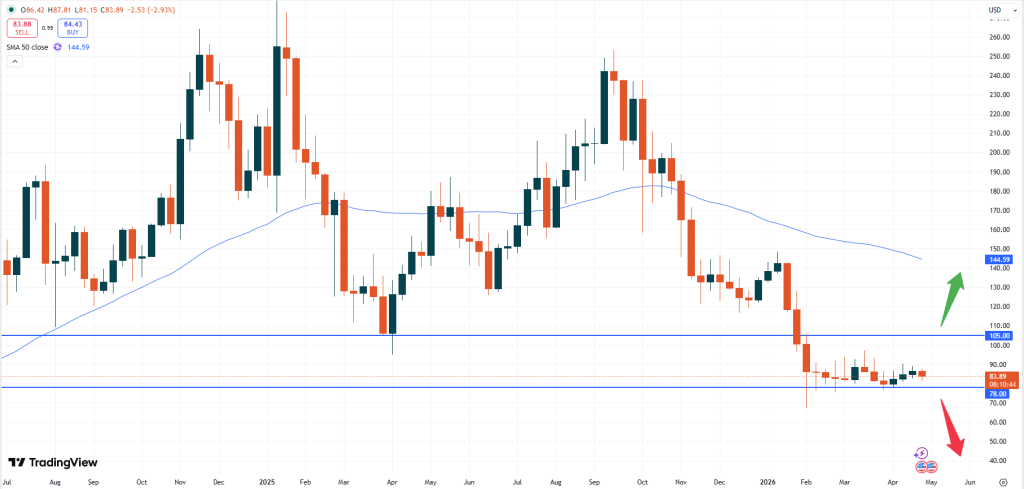
– SOL: Solana is currently trading at USD 83.89. The market remains range- bound as Solana is not able to push significantly higher. Instead, the positive sentiment of the previously mentioned tokens can’t be observed with Solana.
SOLUSD, weekly chart
Traders should now pay attention to the upcoming support zone of USD 78.00. A break below that zone might indicate that the bearish sentiment will continue. On the other hand, the price of Solana needs to push beyond USD 105 in order to also qualify for more upside momentum. That level has been very important in March 2025.
Vantage does not represent or warrant that the material provided here is accurate, current, or complete, and therefore should not be relied upon as such. The information provided here, whether from a third party or not, is not to be considered as a recommendation; or an offer to buy or sell; or the solicitation of an offer to buy or sell any financial instruments; or to participate in any specific trading strategy. Any research provided does not have regard to the specific investment objectives, financial situation and needs of any specific person who may receive it. We advise any readers of this content to seek their own advice. Without the approval of Vantage, reproduction or redistribution of this information is not permitted.