Last week’s strong upward trend in the stock market has not yet extended to the crypto market. Although the Nasdaq technology index is lagging behind the S&P 500, positive momentum is likely to take hold here soon as well. Bitcoin, however, has so far only managed to advance to the most recent resistance level without breaking through that zone.
Meanwhile, the “Digital Markets Clarity Act” in the U.S. appears to be moving to the next stage. While the impact on Bitcoin is likely to remain limited, ETH and XRP could continue to rise should the bill pass the Senate. Tokens such as Solana could also benefit from the new regulations, particularly due to their smart contract networks. Such networks could benefit the most once the question of whether a token constitutes a security is clarified.
Ultimately, some regulatory news and an improvement in overall risk sentiment could be exactly what’s needed for the crypto market to regain momentum.
Technical Analysis:
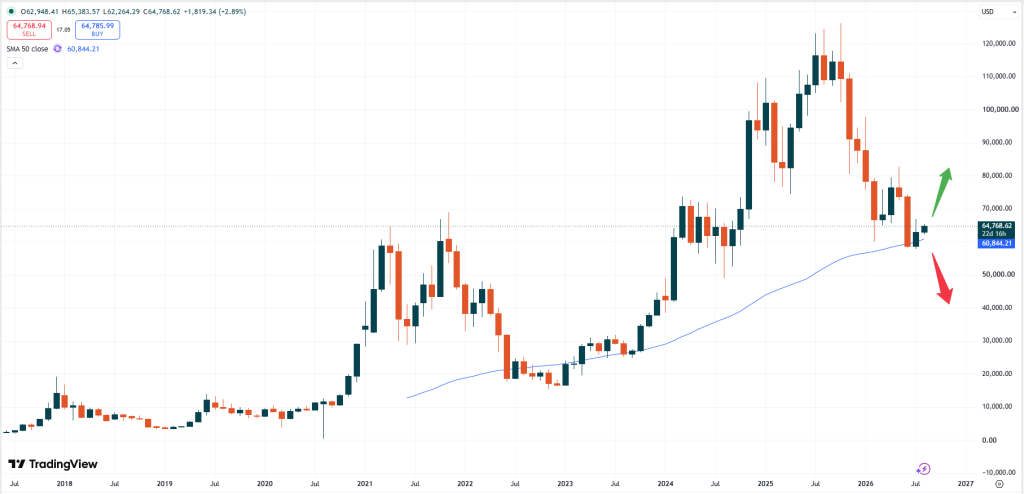
– BTC: Bitcoin is trading at $60,844. The slightly positive sentiment surrounding the token has regained some momentum, allowing Bitcoin to rise once again. With another breakout above the 50-day moving average zone, more positive momentum could now follow.
BTCUSD, monthly chart
As the monthly chart above shows the 60,000 USD support level needs to hold in order to offer more upside momentum. If the price can now also break above the 67,000 USD zone the uptrend might gear up more steam. That zone marked an important support zone in February this year and might now remain a strong resistance area. Positive momentum in BTC might be needed for altcoins to move higher as well.
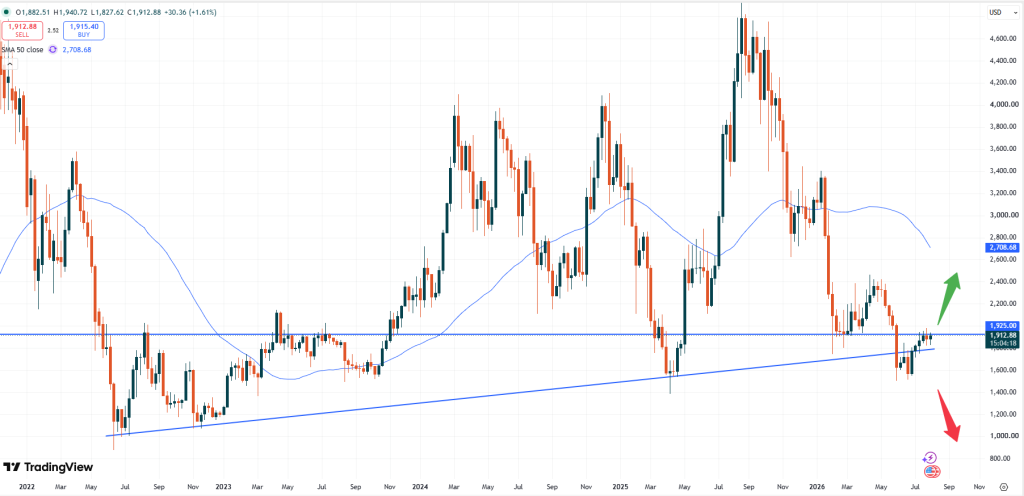
– ETH: Ethereum is currently trading at USD 1,913. Similarly to Bitcoin the positive momentum of ETH might also gear up fresh steam if the market is able to clear the next resistance zone.
ETHUSD, weekly chart
Based on the weekly chart above the resistance at 1,925 USD needs to break in order to potentially see another push higher. A break above the 2,000 USD level might even attract more buyers. That zone marks another longer- term resistance level and will signals that the longer- term downtrend has been broken.
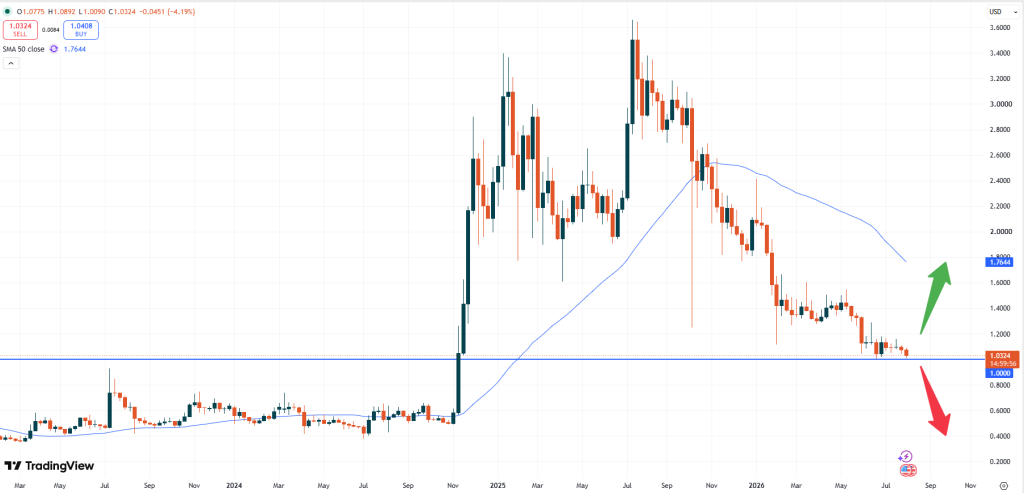
– XRP: Ripple is trading at USD 1.0324. Compared to BTC and ETH, XRP keeps lagging behind. Without significant upside in sight the price might continue to move to the downside. The downtrend might also start to gear up fresh momentum, if the 1.0000 USD zone will break.
XRPUSD, weekly chart
As the weekly chart above shows any attempts of this market to move higher has been stopped shortly after a few weeks of rising prices. In recent weeks the upside has been totally absent, which signals that falling prices should be expected. A break of a technical resistance, like the 1.2000 USD zone, for example might be needed in order to change the market direction.
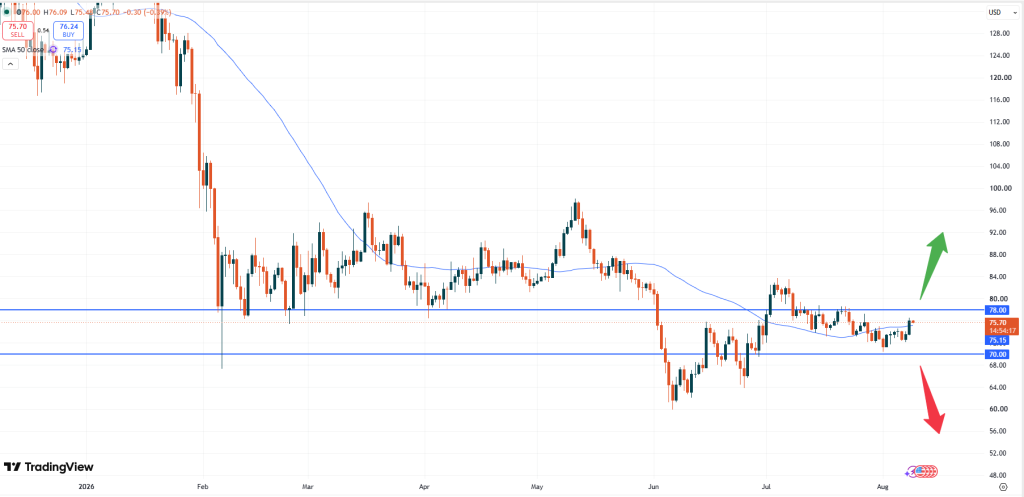
– SOL: Solana is trading at USD 75.70. Last week SOL started to break above the 50- moving average zone again, which should be seen as a positive signal. If Solana is able to also march above the 78.00 USD resistance area more upside might be found.
SOLUSD, daily chart
Then, above the 85.00 USD level renewed upside might follow. That area remains the strong resistance zone of the long- term downtrend. Vice versa, a break below the psychological 70.00 USD range might cause the downtrend to continue.
Vantage does not represent or warrant that the material provided here is accurate, current, or complete, and therefore should not be relied upon as such. The information provided here, whether from a third party or not, is not to be considered as a recommendation; or an offer to buy or sell; or the solicitation of an offer to buy or sell any financial instruments; or to participate in any specific trading strategy. Any research provided does not have regard to the specific investment objectives, financial situation and needs of any specific person who may receive it. We advise any readers of this content to seek their own advice. Without the approval of Vantage, reproduction or redistribution of this information is not permitted.


 About Us
 Premium Client
 Premium Perks
 Promotions
 Premium Trading


 Vantage Plus Research Team