Despite the moderate upside momentum in equity markets last week, the crypto market has not been able to rise as well. Instead, most tokens even printed negative candlestick patterns, which might even translate to further losses.
One of the negative headlines comes from Strategy. Michael Saylor’s company sold 1,690 Bitcoins in value of more than 108 million USD. The company still holds about 840,000 Bitcoin in their portfolio. Yet, with an average purchase price of 75,385 USD losses keep piling up. The funds will be used for dividend payments as well as increasing US- dollar reserves. However, in statements earlier last week, the Strategy CEO Phone Le also stated that the company will start to accumulate more BTC if prices will correct further.
Overall, altcoins remain more vulnerable for further losses, while ETH remains stable. Traditionally a rise in gold prices has helped the crypto market to gear up some momentum. If the positive move in the shining metal continues this might also support the crypto market in the following weeks.
Technical analysis:
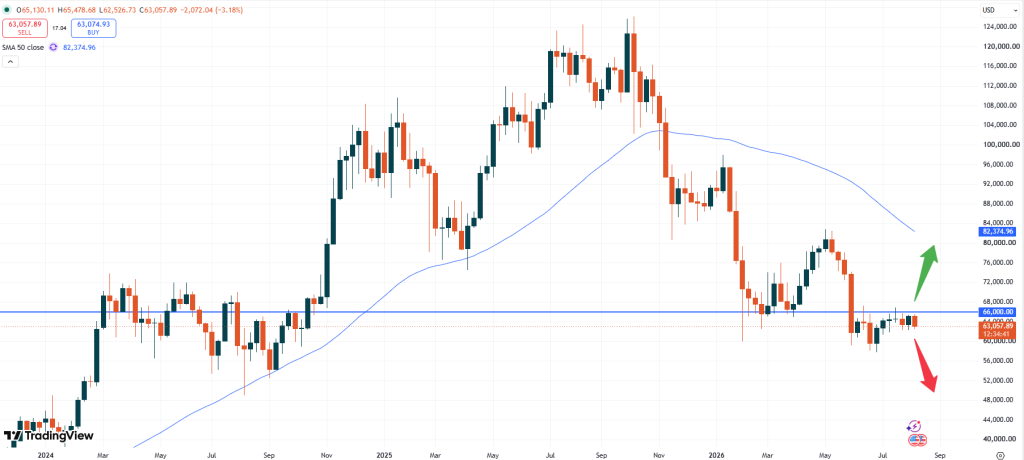
– BTC: Bitcoin is trading at USD 63,057. The price of Bitcoin has not been able to stabilize last week and seems vulnerable for further losses this week. Any increase in geopolitical tensions might cause some setbacks. BTC has not been able to rise alongside the positive data from the earnings season as well as the rise of the Nasdaq technology index. In the end the market needs to move beyond 66,000 USD technical resistance zone in order to push towards higher levels.
BTCUSD, weekly chart
As the daily chart above shows, the technical resistance zone in blue color needs to break. That level has been a strong support earlier this year and will now remain a sticky resistance area.
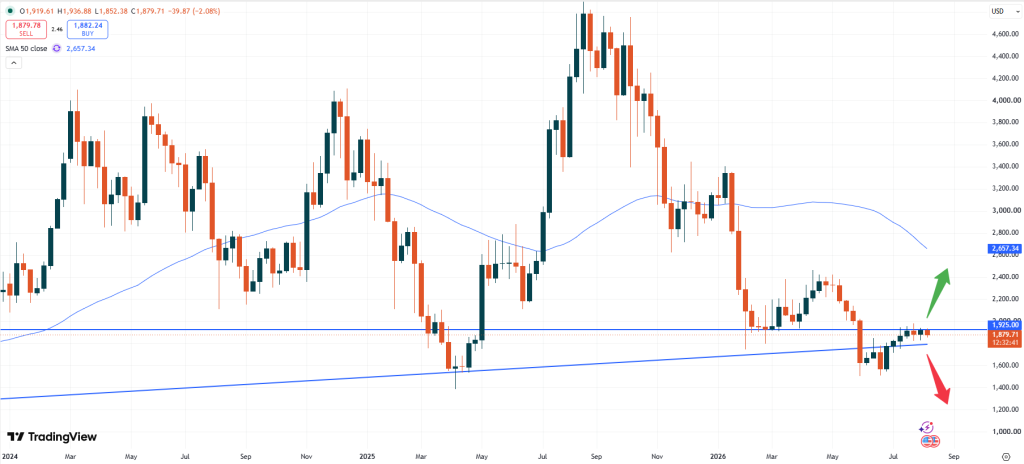
– ETH: Ethereum is trading at USD 1,880. Similarly to BTC also the price of ETH remains prone for further profit- taking. With the market currently trading below the 1,925 USD resistance area traders should pay attention to the upcoming support level. However, the positive news might be, that the price is still able to trade above the 1,800 USD zone.
ETHUSD, weekly chart
Any attempt of Ethereum to break the 2,000 USD level should relief the bearish market sentiment helping the renewed upside momentum to gear up steam. As observed before a sudden increase in the price might then boost the market quickly.
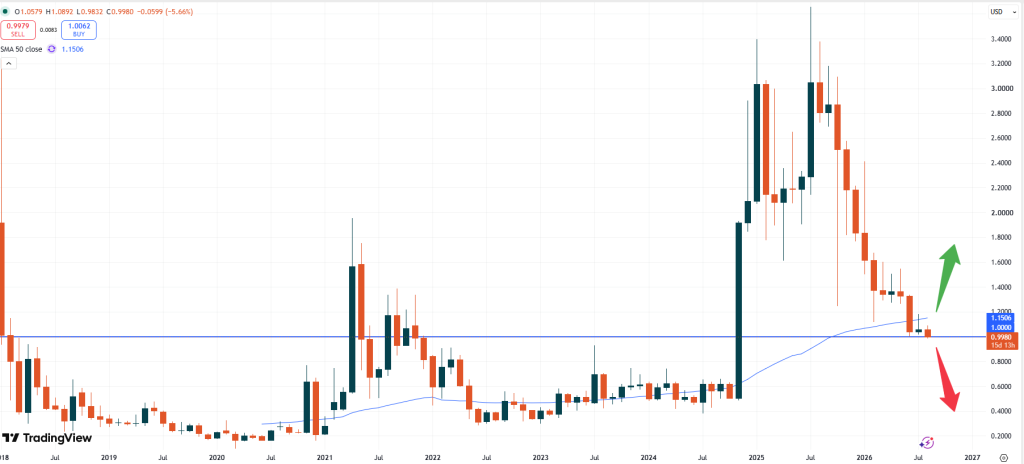
– XRP: Ripple is trading at USD 0.9979. Ripple broke the important support level of 1.0000 during last week’s trading. However, with the market remaining relatively stable around that zone, some upside momentum might still be on the cards. The chances of a “relief rally” will diminish, tough, if no upside can be observed during the first trading days this week.
XRPUSD, monthly chart
If the market remains bound for lower prices XRP might fall towards the 0.5000 USD target. The negative sentiment only changes direction if Ripple is able to rise beyond the 1.1500 USD level. At that zone the 50- moving average comes into play, which currently also acts as a strong resistance area.
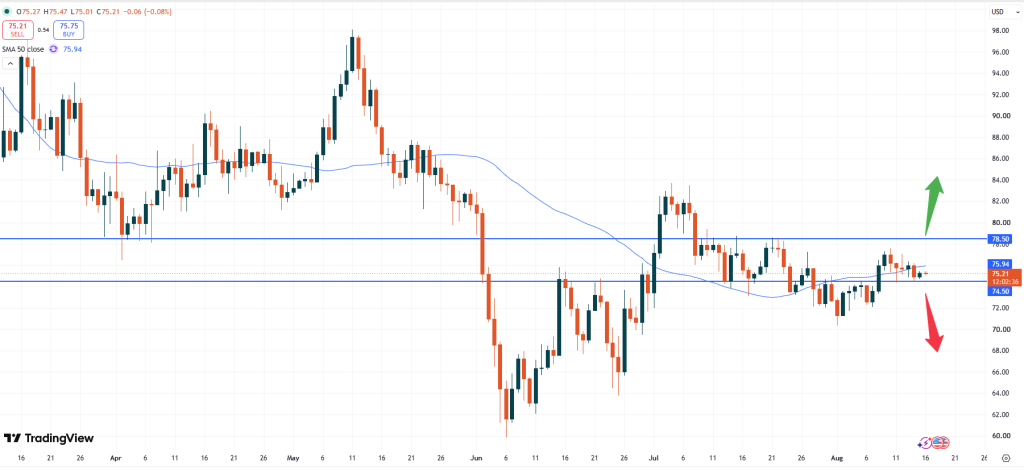
– SOL: Solana is trading at USD 75.21. The market remains capped between two important zones. However, the upside remains limited with potentially further losses on the horizon. Problems arise within their technology. Due to a routing error within the Solana network nearly 30% of the staked tokens went briefly offline. That was close to the 33.34% threshold, where no transactions would have been finalized any further. A problem in a data center in Miami extended towards Europe and Asia.
SOLUSD, daily chart
On a technical note, the price of Solana remains capped below the 50- moving average level. If the market breaks below the 74.50 USD zone, more downside might occur. The market might then retest the lows from earlier this year.
Vantage does not represent or warrant that the material provided here is accurate, current, or complete, and therefore should not be relied upon as such. The information provided here, whether from a third party or not, is not to be considered as a recommendation; or an offer to buy or sell; or the solicitation of an offer to buy or sell any financial instruments; or to participate in any specific trading strategy. Any research provided does not have regard to the specific investment objectives, financial situation and needs of any specific person who may receive it. We advise any readers of this content to seek their own advice. Without the approval of Vantage, reproduction or redistribution of this information is not permitted.


 About Us
 Premium Client
 Premium Perks
 Promotions
 Premium Trading


 Vantage Plus Research Team